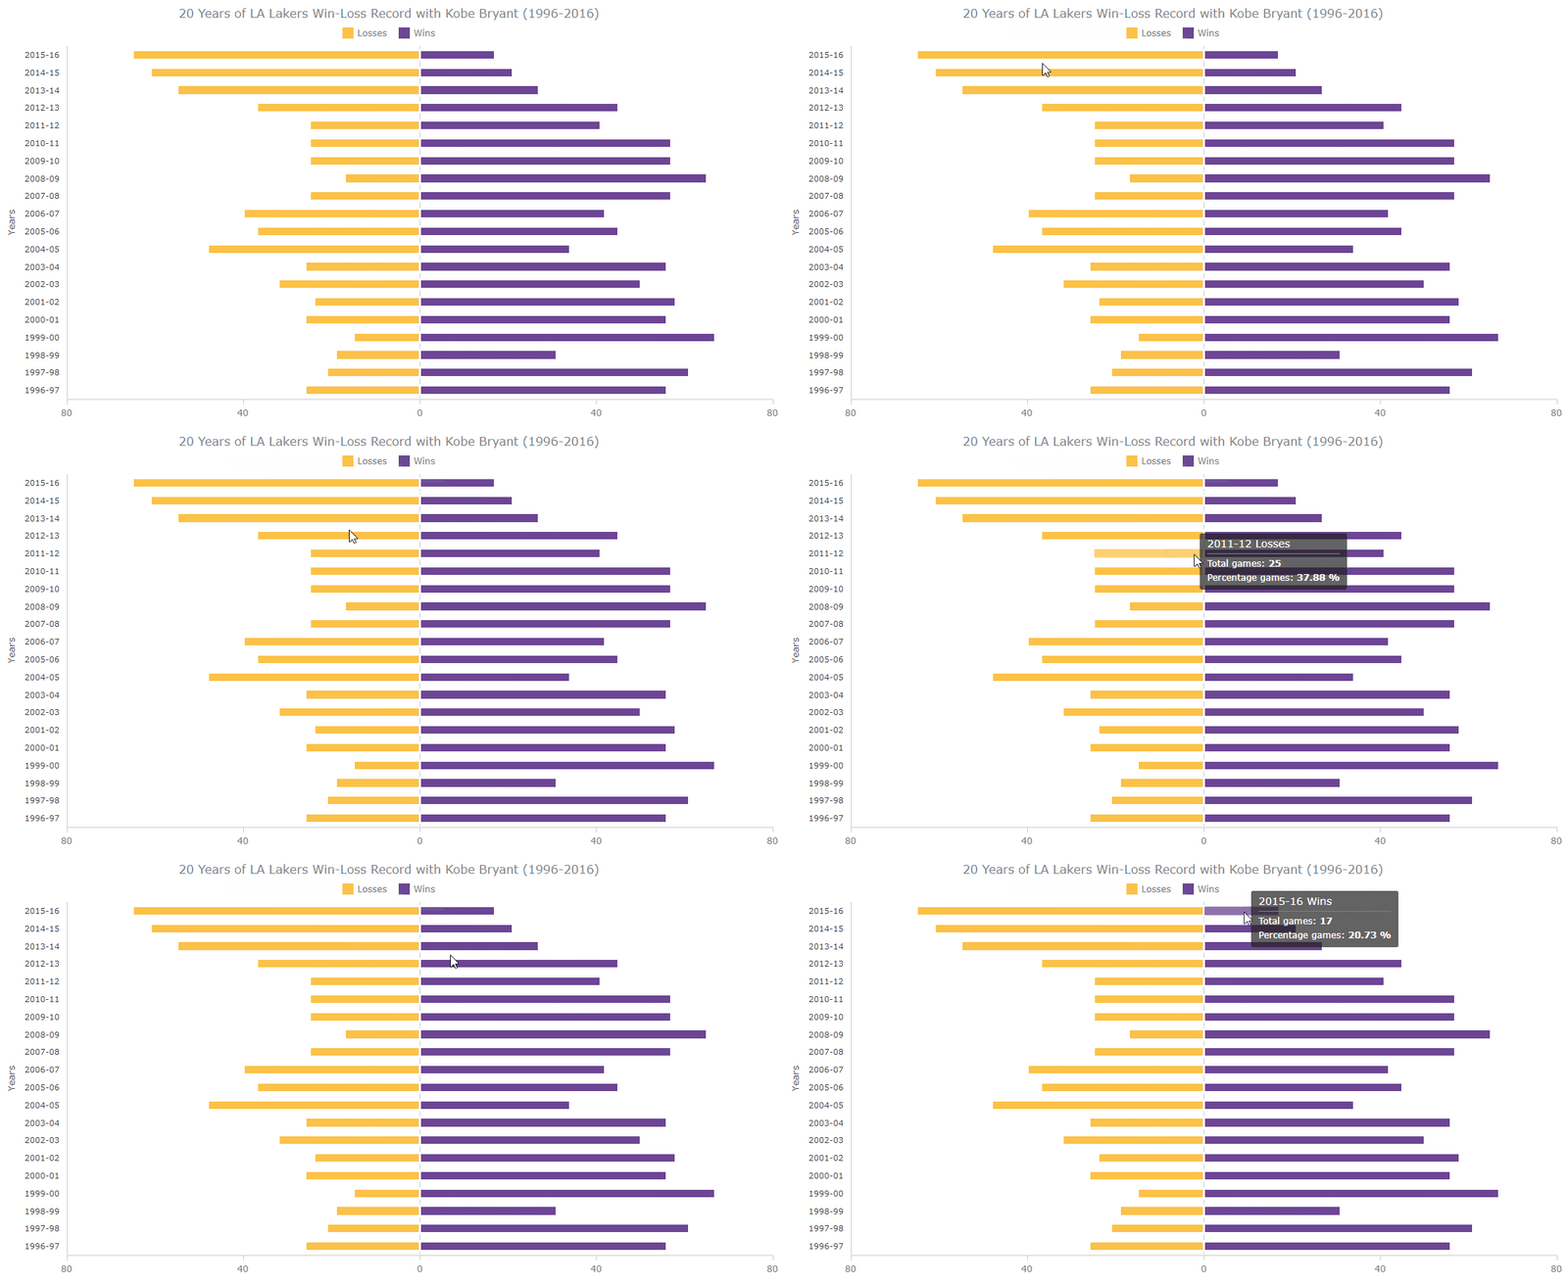
If you want to learn how to easily build Diverging Bar Charts using JavaScript, there's a great step-by-step tutorial published on freeCodeCamp just last week.
Remembering Kobe Bryant one year after his death, Shachee Swadia, the author, used range bars to visualize the Los Angeles Lakers' wins and losses during all the 20 years with Kobe Bryant on the team, 1996-2016 🏀
The tutorial starts by demonstrating 4 fundamental steps to create a basic diverging bar chart using a JavaScript charting library; AnyChart JS is used for illustration; then the article walks you through several quick customizations of the visualization.
As a result, you've got both a compelling interactive diverging bar chart to explore the Lakers' win-loss record and a clear understanding of how to visualize data that way:
Check it out on freeCodeCamp! All chart examples built along the tutorial are available on CodePen with the full source code.


Top comments (0)