Monitoring for your Node.js apps can be hard. The tricky part is understanding what you need to monitor, instrumenting your code, and then making sense of all the data that’s been emitted. (That's almost every part you might say 😅 ).
At AppSignal, we dogfood our product and understand the pain users feel ourselves. The key points we focus on are the ease of use, flexibility, and developer experience. As time is the most valuable resource you as a developer have, we always strive to save it for you.
Setting Up Monitoring for Node.js - Handsfree Mode
In order to understand which pieces of your code are causing performance problems, you’ll need to add instrumentation to it. That way, you can break down all the actions and measure which ones are the slowest.
With AppSignal’s automatic instrumentation, we take away as much manual work as we can. Just run a few commands through the CLI, and you'll be set.
Our monitoring agent detects the different parts of your infrastructure and automatically instruments it. This enables AppSignal app to digest, process, monitor, and show you the graphs and dashboards you need the most.
Out-of-the-box Instrumentation
Here's a list of tools AppSignal will automatically instrument for you:
| Type | Tool |
|---|---|
| Framework | Next.js |
| Framework | Express.js |
| Database | PostgreSQL |
| Database | Redis |
| API | Apollo |
Integration Examples
"A screenshot is worth a thousand words", an unknown developer once said.
Next.js
AppSignal for Node.js automatically instruments all incoming HTTP requests by default. However, as Next.js deals in the concept of "Pages" rather than routes, we need to be able to group all the requests made for your pages together with an action name.
Inside the Next.js integration itself, we export a page-aware handler that can either be used with a Next.js custom server instance or with an Express.js app. With the integration in place, your actions now have the HTTP method and pathname for your page added to them. This enables you to see a specific error or a performance incident. Here’s a screenshot of the error page where an error occurs for a GET request with the / path:
This will make it easier to pinpoint what case is leading to that error. In a performance issue you will now also see that actions have the HTTP method and pathname added. In our example, in the screenshot underneath, you’re looking at a sample for a POST request with the /graphql path.
PostgreSQL
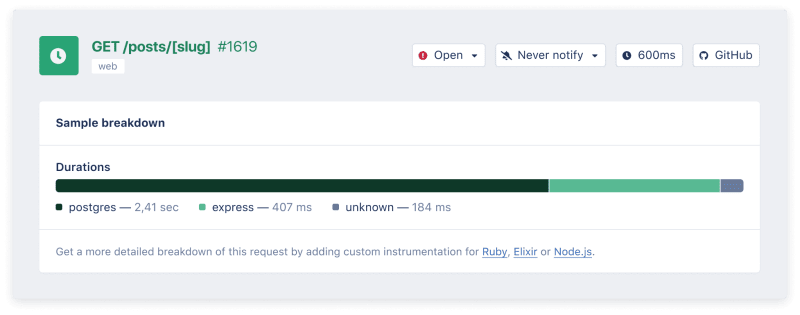
You will see a more detailed breakdown of the events within a particular request. This is enabled for knex, bookshelfjs, typeORM and all other consumers of the pg library. Here’s an example where you can see the duration of a PostgreSQL process within a sample:
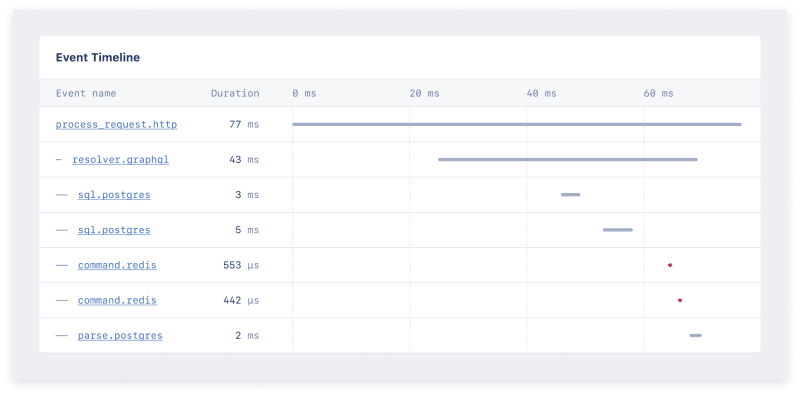
If we zoom in further on the performance of this sample, further down the page you'll find a timeline of all events. This now has your PostgreSQL consumers detailed.
The integration shows you the tracing for database calls, so you can see what query is the root of your evil (or genius) 😉.
Redis
With Redis integration, you'll see your calls to Redis appear in the Event Timeline:
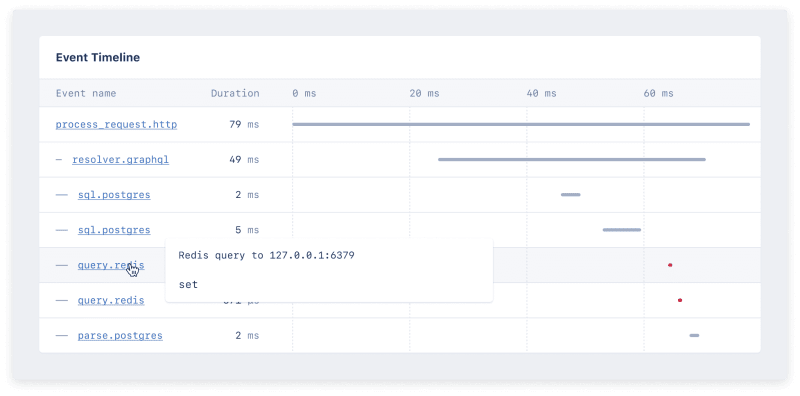
You'll also be able to see the name of the command sent to Redis and the address of the Redis instance that the query was made to:
This is great news for those who wish to debug long running calls to a Redis cache. You can even set an anomaly trigger to send an alert on requests that run for a super long time!
Apollo
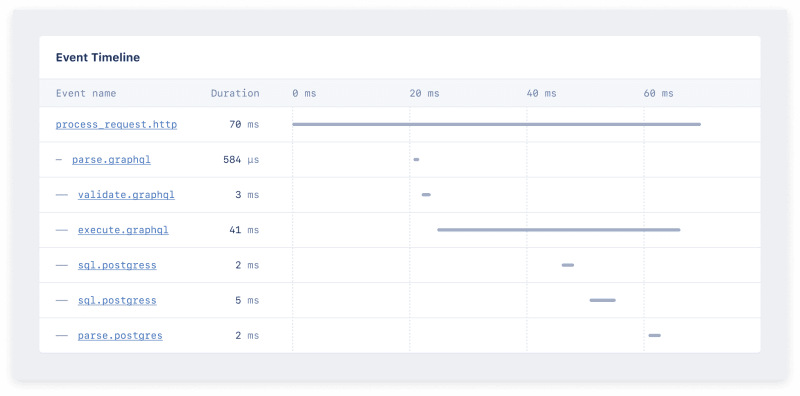
Once you've finished with the installation, you'll see your resolvers appear in the Event Timeline. You'll be able to see a breakdown of the time it took to parse, validate and execute your resolver:
You'll also be able to see the name and body of the operation when you hover over the resolvers execution phase:
This is great for those who wish to debug GraphQL queries that seem to take a long time, and you're not sure where the slowdown could be occurring. Don't forget about our anomaly triggers here also - these can be very useful for alerting when the query time reaches a certain threshold.
Try AppSignal: Monitoring Made Easy And Sweet 🍪
If you haven't used AppSignal before, now you know how we save you time by making monitoring easier. We'd love you to try us out. When you do, feel free to reach out, we'll send you a free box of stroopwafels as well.
PS. If you are helping the world with a great OSS project, we help you back with a free AppSignal account. Spread the word to the maintainers you value! We've got your back.


Top comments (0)