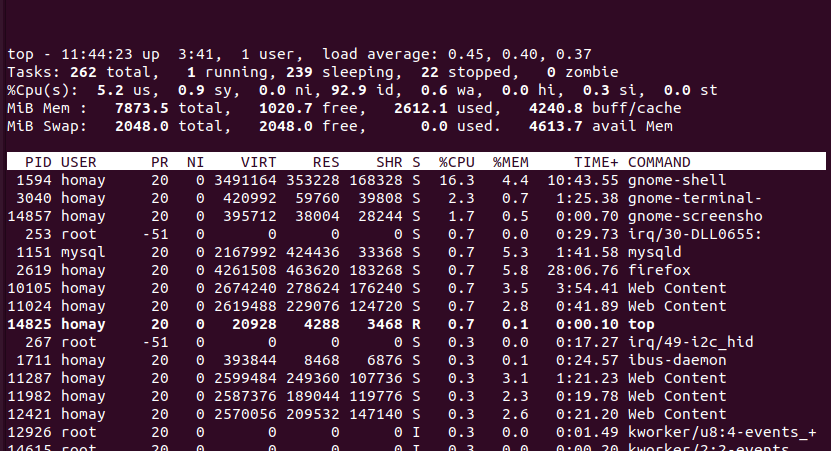
$top
-Shows live processes currently running
-Only shows processes for a certain period of time (Like a drawback)
-The $ps command fails to show trend of processes that are being swapped in and out of memory; thus $top command

First Line:
Shows general system information
-Current time
-How long the system has been up
-The number of users logged in
-The load average
*more about the load average:
The load average is displayed in three different time marks:
- 1-minute
- 5-minute
- 15-minute
It's not uncommon for the 1 minute mark to be high, but if the 15 minute mark is high then system is in trouble
If load average starts getting over 2, it generally is high value. But it is also subjective to the system and the processes being run.
Second line
The second line shows general process info (called tasks)
-Running process
-Sleeping process
-Stopped process
-Zombie process (Process has stopped but parent has not responded)
Third line
The third line shows general CPU utilization info broken down into several categories (Eg system process vs user process etc)
Fourth and Fifth line
Shows system memory stat: used, free etc
Finally
The detail list of currently running process.
PID
The process ID of the process
USER
The user name of the owner of the process
PR
The priority of the process
NI
The nice value of the process (This is used to determine priority)
VIRT
The total amount of virtual memory used by process
Virtual memory is created taking space of actual physical/secondary memory called swap space.
RES
The total amount of physical memory used by the process
SHR
The amount of memory the process is sharing with other processes
S
The process status:
- D Interruptible sleep
- R Running
- S Sleeping
- T Traced or stopped
- Z Zombie
%CPU
The amount of CPU time the process is using
MEM
The share of available physical memory the process is using
TIME+
The amount of CPU time the process has used since starting
COMMAND
The command line name of the process (programs started)


Top comments (0)