Have you ever heard about entropy?
As Stephen Hawking framed it:
You may see a cup of tea fall off a table and break into pieces on the floor... But you will never see the cup gather itself back together and jump back on the table. The increase of disorder, or entropy, is what distinguishes the past from the future, giving a direction to time.
In other words: things will fall apart eventually when unattended.
But let’s not get too depressed or comfortable with things just turning into chaos naturally. We can and do fight back against it. We can exert effort to create useful types of order resilient enough to withstand the unrelenting pull of entropy by expending energy.
Let’s start from the beginning.
What does a development cycle look like?
When developing software, we feel entropy. That’s why we usually put extra effort into following some development cycle.
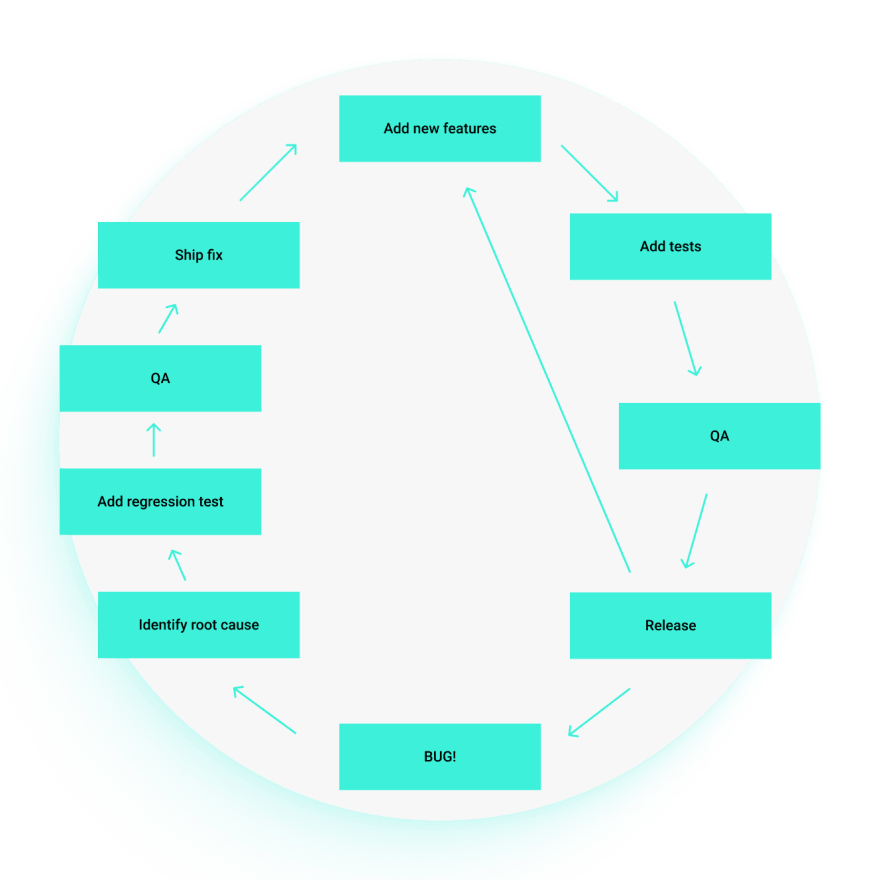
For example, we start with adding a new feature. During development, we sprinkle it with a bunch of tests. When we’re done, we send it to QAs. They accept it and promote our code to a production release channel. And we’re back to adding another feature.
That’s quite a simplified version of what we usually do. Because, among other things, we don’t take into account that wild bugs may appear!
Our experience tells us to keep it cool, identify the root cause, and add a regression test so it never breaks again. Then we send it to QA once again, ship it, and go back to adding features.
We’re happier with our workflow now; it works well. We’re adding feature after feature. Our app release cycle is so well designed that even adding ten new developers doesn’t slow us down. Until we take a look at our app reviews:
Why do you need to continuously monitor the performance of your app?
We realize that our perfect workflow based on Science™, our experience, and “best practices,” which was supposed to prevent our app from falling apart, is not resilient to particular bugs. Namely, performance regressions.
Our codebase doesn’t have the tools to fight these. We know how to fix the issues once spotted, but we have no way to spot them before they hit our users.
Coming back to our entropy example, in other words, we could say that performance will fall apart eventually when unattended. If we don’t do anything to optimize our app while adding new code and letting the time go by, it will certainly get slower.
We don’t know when it will happen. Maybe tomorrow, maybe in a week,or in a year.
If only there’s been an established way of catching some of the regressions early in the development process…
Wait a minute, there is!
How to monitor app performance regression?
With fully automated regression tests! Tests that run in a remote environment on every code change, and that already are a part of our development process.
Before we pick the best tool for the job, let’s consider the impact and what’s worth testing.
The most common React (Native) performance issues
As with test coverage, there’s a healthy ratio that we strive for to provide us with the best value for the lowest amount of effort. We want to target regressions that are most likely to hit our users.
At Callstack, we identified React Native performance issues our developers deal with daily.
Slow lists and images, SVGs, React Context misusage, re-renders, slow TTI, are among the most common ones. If we look at this list from the origin of the issue point of view, we’ll notice that a vast majority of these come from the JS side.
We estimate that most of the time our developers spend fixing performance issues, around 80%, originating from the JS realm, especially from React misusage. Only the rest is bridge communication overhead and native code – like image rendering or database operations – working inefficiently.
It’s fair to say that we expect to encounter these problems in both React web apps and React Native mobile apps.
We did our research and didn’t find any library allowing us to reliably write performance regression tests for React or React Native. We’d like to have it integrated with the existing ecosystem of libraries we’re using.
The perfect library for measuring performance regression should:
- measure render times and count reliably,
- have a CI runner,
- generate readable and parseable reports,
- provide helpful insights for code review, and
- have a stable design based on React public API.
Using our experience from developing the React Native Testing Library, we created Reassure—a performance regression testing companion for React and React Native components. We developed it in partnership with Entain – one of the world’s largest sports betting and gaming groups.
How does Reassure work?
Reassure builds on top of your existing React Testing Library setup and sprinkles it with an unobtrusive performance measurement API.
It’s designed to be run on a remote server environment as a part of your continuous integration suite.
To increase the stability of results and decrease flakiness, Reassure will run your tests once for the current branch and another for the base branch.
In the near future, with sufficiently stable CI, we’ll be able only to run the tests once and compare the results with the ones from the past.
To ensure a delightful Developer Experience, Reassure integrates with GitHub to enhance the code review process. Currently, we leverage Danger.js as our bot backend, but in the future, we’d like to prepare a plug-and-play GitHub Action.
Let’s take a look at what it takes to incorporate Reassure into your regression testing pipeline.
Write performance regression tests
Before you write your first test, you need to install Reassure:
yarn add --dev reassure
# or
npm install --save-dev reassure
Now you can start writing your performance tests. Let’s take a look at this example:
// counter.perf-test.tsx
test('Count increments on press', async () => {
  const scenario = async (screen: RenderAPI) => {
    const button = screen.getByText('Action');

    await screen.findByText('Count: 0’);
    fireEvent.press(button);
    fireEvent.press(button);
    await screen.findByText('Count: 2');
  };

  const stats = await measurePerformance(
    <Counter />,
    { scenario, runs: 20 }
  );
  await writeTestStats(stats);
});
We created a new file with “.perf-test.tsx” extension that reuses our component test in a scenario function. It takes an optional screen argument which is, in fact, a return value of Testing Library’s render helper.
The scenario is then used by the measurePerformance method from Reassure, which renders our Counter component, in this case, 20 times, letting the React Profiler to measure render count and duration times for us. In the end, we call writeTestStats to save this data to the filesystem.
And that’s usually all you have to write. Copy-paste your existing tests, adjust, and enjoy your app being a little bit safer with every test.
Run Reassure
Now that you have your first performance regression test created, it’s time to run Reassure somehow! It’s important to mention that you need to measure the performance of two versions of your code – the current (modified one) and the baseline. Reassure will compare the two to determine whether there are any regressions in the current code version.
Since the goal is to run the performance tests on the CI environment, we want to automate this task. To do that, you will need to create a performance testing script, like this one:
# Gather baseline perf measurements
git switch main
yarn install --force
yarn reassure --baseline

# Gather current perf measurements & compare results
git switch -
yarn install --force
yarn reassure
And save it in your repository, e.g. as reassure-tests.sh.
The script switches to your base branch, installs dependencies, and runs yarn reassure --baseline to gather the base metrics. Once done, it switches back to your current feature branch, installs dependencies again, as those might have changed, and runs yarn reassure again.
See the performance test results
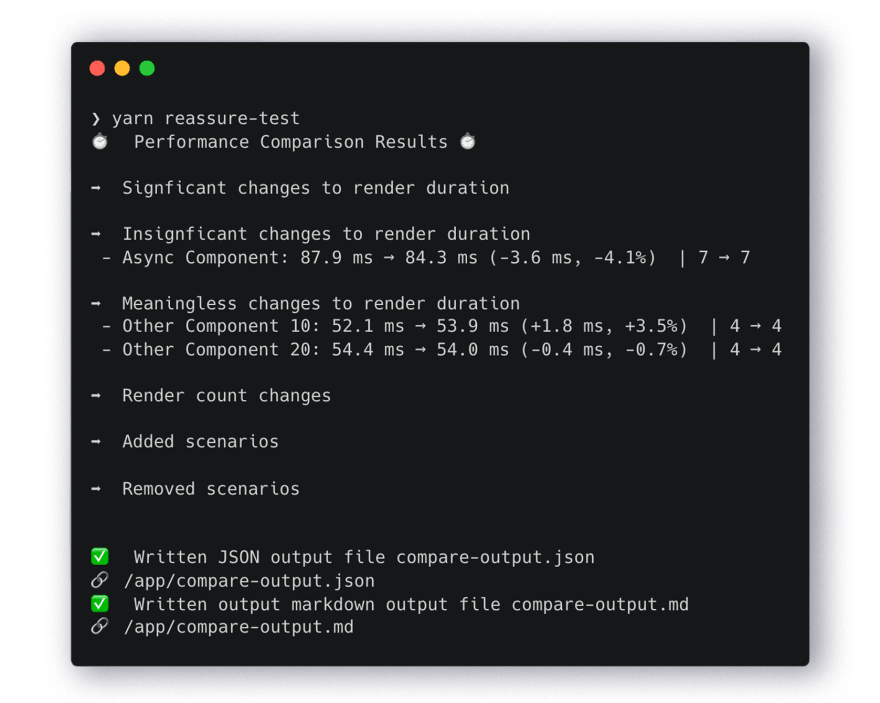
Having all that data, Reassure can present the render duration times as statistically significant or meaningless.
Apart from render times, another useful metric that may easily degrade is render counts, which we get for free from React Profiler.
All this information is stored in a JSON format for further analysis and Markdown for readability.
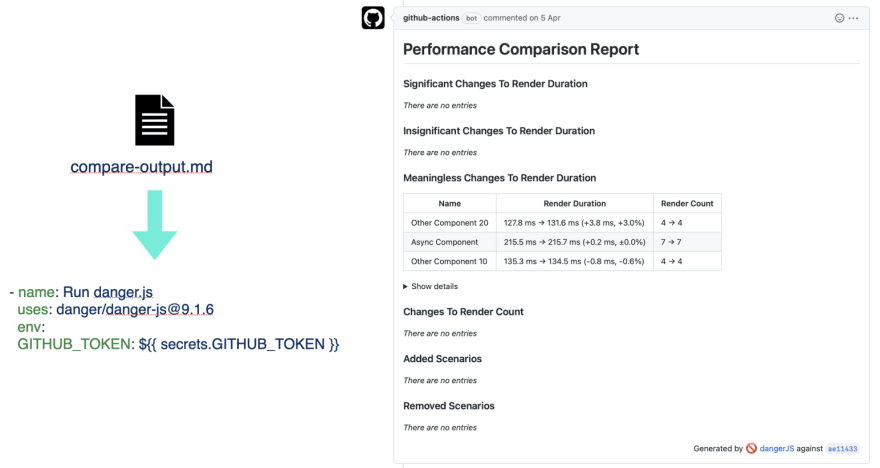
We use the markdown output as a source for the GitHub commenting bot powered by DangerJS.
This is by far our favorite and recommended usage of this tool, as it enriches the code review process while allowing us to alleviate the instability of the CI we’re using.
What have we learned from developing Reassure?
Developing Reassure has taught us some valuable lessons about
- running benchmarks with Node.js, and
- measuring precision in JavaScript.
Let’s dive into it!
Challenges of running benchmarks with Node.js
Running benchmarks is not a piece of cake even in non-JS environments, but it’s particularly tricky with Node.js.
The key is embracing stability and avoiding flakiness. Operating in a JavaScript VM, we need to considerJIT, garbage collection, and module resolution caching.
Then we have a cost of concurrency that our test runner embraces for execution speed. We need to pick what to average, what to percentile, and how to apply statistical analysis. And a lot more.
Running tests once or twice is not enough to make sure our measurement results make sense mathematically. Taking other things into account, ten times is a good baseline for our use case. Then, to determine the probability of the result being statistically significant, we need to calculate the z-score, which needs the mean value (or average), divergence, and standard deviation.
Reassure handles all of that for you, so you don’t even have to think about it.
What you probably didn’t know about measurement precision in JavaScript
Measurement precision is another tricky topic in the JS land.
React Profiler uses performance.now() API to reliably measure rendering time. Node.js implements the W3C recommendation, which—due to privacy concerns—requires a resolution of no less than 5 microseconds.
We can measure a 1 ms render with at least 0.5% error. This is usually good enough. But because many lighter components render faster than 1 ms, and due to the variable stability of the machine, we run them at least ten times anyway and let you configure that as well.
Now, module resolution caching is great for our Node.js apps.
But it bit us when developing the library. As it turned out, subsequent execution of the same component often resulted in even ten times slower runs. As you can imagine, averaging that would make the results unreliable. So we drop the slowest test as most likely it’s skewed by the lack of cache.
Wrapping Up
Even if you don’t have performance issues at the moment, they will appear sooner or later. We speak from our experience with many clients. Reassure will allow you to spot them once they appear.
With Reassure, you can
- test whole screens or even screen sequences
- perform component level tests are possible but often require more runs
- reuse your RNTL tests if you have them, and
- all established Testing Library practices apply, so let your tests resemble users’ behavior and avoid mocking anything other than I/O.
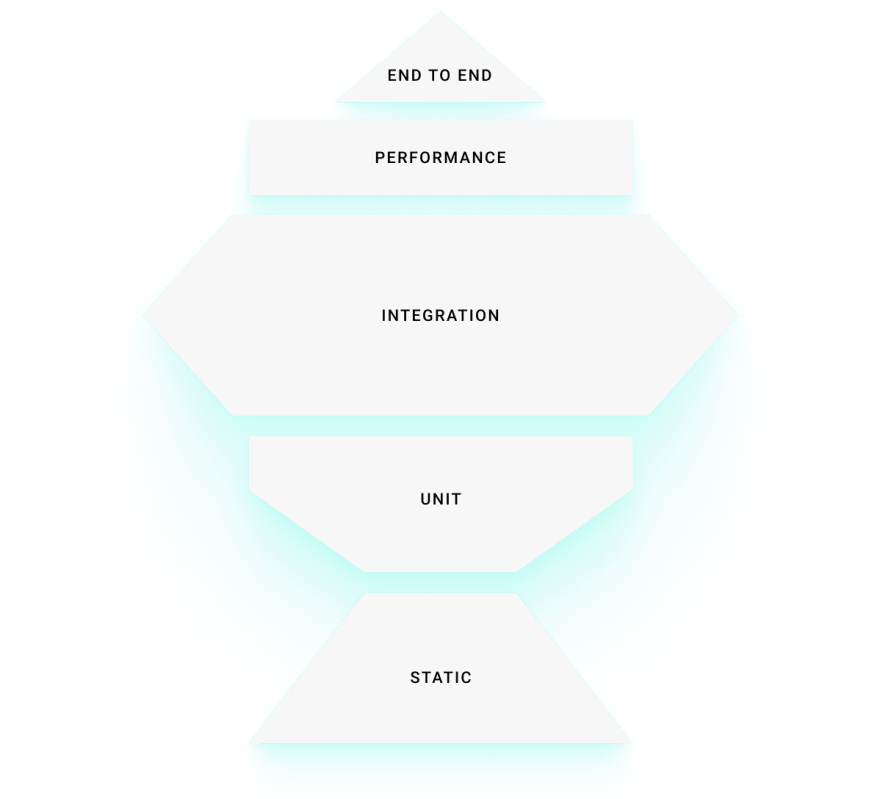
Due to their qualities, frontend perf tests seem to resemble end-to-end tests for our apps. And it makes sense to treat them as such in our testing trophies or pyramids.
Remember that performance is not a goal. It’s a path. Walk it with confidence.
Reassure is Open Source
Like all of the tools we build at Callstack, Reassure is an Open Source software, released under an MIT license. Feel free to check it out on GitHub to see the complete installation and usage guide. And if you liked it—star it!
We’re excited to see how you use it and how it helps you guard the performance of your apps. So don’t be afraid to hit the “Issues” tab to let us know.
And if you want to listen to a talk with me, Maciej Jastrzębski, and our host, Łukasz Chludziński, take a look at one of the episodes of The React Native Show.
Happy testing!
This article was originally published at callstack.com on September 21, 2022.


Top comments (0)