Let's look at some trending repositories in the JS / TS community.
Whistle - request debugging tool
Whistle is a powerful local tool leveraging nodejs to intercept and analyse local requests.
offer HTTP proxying
capture, replay or compose requests of HTTP, HTTPS, WebSocket and TCP.
manipulate http request and response by configuring hosts, or patterns like domain, path, regular expression, wildcard characters, wildcard path, etc.
offer build-in mobile debugging mode
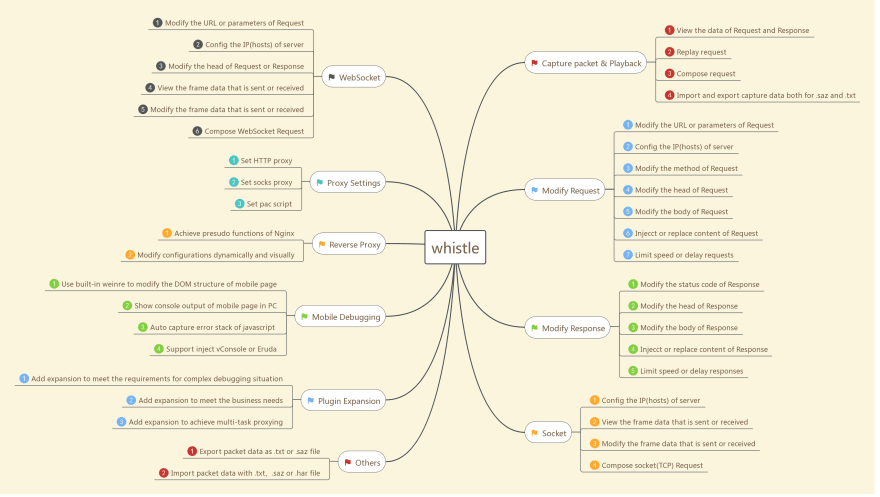
Functional Map:
Source:
English | 简体中文
We recommend updating whistle and Node to ensure that you receive important features, bugfixes and performance improvements Some versions of Node have bugs that may cause whistle to not work properly, for detail see the issue: #231
whistle
whistle is a cross-platform web debugging tool based on Node.js.
It features the following:
- offer HTTP proxying
- capture, replay or compose requests of HTTP, HTTPS, WebSocket and TCP.
- manipulate http request and response by configing hosts, or patterns like domain, path, regular expression, wildcard characters, wildcard path, etc.
- offer build-in mobile debugging mode
If the aboves can't satisfy your requirements, you can also use plugins to extend its capabilities.
The specific functions are as follows:
Manipulations to http request and response in whistle can be achieved as a Rule looks like:
pattern operatorURI
Description:
-
pattern is an expression to match the target request url. You can write…
GPUJS - GPU accelerated javascript
This library helps you leverage GPU to accelerate various tasks. The repository contains examples on how to use it with leaflet, canvas, path-finding algorithms and more!
Source:
GPU.js
GPU.js is a JavaScript Acceleration library for GPGPU (General purpose computing on GPUs) in JavaScript for Web and Node GPU.js automatically transpiles simple JavaScript functions into shader language and compiles them so they run on your GPU In case a GPU is not available, the functions will still run in regular JavaScript For some more quick concepts, see Quick Concepts on the wiki.
What is this sorcery?
Creates a GPU accelerated kernel transpiled from a javascript function that computes a single element in the 512 x 512 matrix (2D array). The kernel functions are ran in tandem on the GPU often resulting in very fast computations! You can run a benchmark of this here. Typically, it will run 1-15x faster depending on your hardware. Matrix multiplication (perform matrix multiplication on 2 matrices of size 512 x 512) written in GPU.js:
Browser
<script src="dist/gpu-browser.min.js">…Master Portfolio - Clean, simple, customizable portoflio
This is a very beautiful portfolio aimed at developers.
Easy theme switching
Simple Github Pages deployment
MIT licensed
Preview:
Source:
 ashutosh1919
/
masterPortfolio
🔥 The Complete Customizable Software Developer Portfolio Template which lets you showcase your work and provides each and every detail about you as Software Developer.
masterPortfolio is being sponsored by the following tool. Please help to support us by taking a look and signing up to a free trial.
Software Developer Master Portfolio 🔥
A clean, beautiful, responsive and 100% customizable portfolio
template for Software Developers!
Sections 📚
To view a live example, click here
Clone And Use 📋
- The website is completely built on
react-jsframework ofjavascriptand that's why we neednodejsandnpminstalled. - While installing
nodejsandnpm, try to install versions which are equal or greater than the versions mentioned in badges above. - In case you want to help developing it or simply saving it, you can fork the repository just by clicking the…
uPlot - lightweight, simple chart library
This library is based on 2D canvas and will let you simply create charts for your data without crazily slowing your website.
- Library < 25kb min
- Can create an interactive chart containing 150,000 data points in 135ms
- MIT licensed
Example:
https://leeoniya.github.io/uPlot/bench/uPlot.html
📈 μPlot
A small (< 25 KB min), fast chart for time series, lines, areas, ohlc & bars (MIT Licensed)
Introduction
μPlot is a fast, memory-efficient Canvas 2D-based chart for plotting time series, lines, areas, ohlc & bars; from a cold start it can create an interactive chart containing 150,000 data points in 135ms, scaling linearly at ~25,000 pts/ms. In addition to fast initial render, the zooming and cursor performance is by far the best of any similar charting lib; at < 25 KB, it's likely the smallest and fastest time series plotter that doesn't make use of context-limited WebGL shaders or WASM, both of which have much higher startup cost and code size.
166,650 point bench: https://leeoniya.github.io/uPlot/bench/uPlot.html
However, if you're looking for true real-time 60fps performance with massive datasets, uPlot can only get you so far WebGL should still be the tool of…
Burlet Mederic
https://mederic.me
https://twitter.com/crimson_med


Top comments (0)