Learn how to use Chrome DevTools to examine the accessibility of your website's content, audit site speed and performance, and more.
Chrome DevTools is a free utility that is integrated into the Chrome browser. Its numerous features enable you to inspect website elements in real time.
Accessing Chrome DevTools
To access the DevTools within the Chrome browser, simply right-click on a webpage and select Examine. This usually appears on the right side of the screen.
You can, however, dock it at the bottom, on the left, or even open it in a new window. Select your dockside by clicking on the three dots adjacent to the settings cog.
Building Your Console Drawer
The console drawer is an auxiliary panel containing normally hidden tools. Coverage, Rendering, and Network Conditions are the most useful for SEO.
You can access the console drawer by clicking the same three dots and selecting Show console drawer.
Once this is opened at the bottom of the elements panel, clicking the three dots there will provide a list of additional tools that can be added in a tab-like format.
Opportunities for SEO auditing
There are various techniques for locating problems, verifying results, and evaluating a website's usability for both users and search engines.
- ### Ensure Accessibility of Content
Search engines should be able to see and crawl your content. Its a basic check thats easy to overlook.
In the Elements panel of DevTools, you can view your page's Document Object Model (DOM).
The DOM is the structure of an HTML document; it chooses the information that should appear on a page as well as the relationships between each element. Additionally, it enables access and page updates for JavaScript.
This panel displays the primary body content and page structure in addition to different content elements, including meta tags, canonicals, and hreflang tags.
You can use the Elements tab to spot variations between the rendered page and the HTML source code since it displays the JavaScript-rendered version of the page.
JavaScript is required to load much of today's web content. This may cause problems with the cached version of the website and influence how Google detects and indexes information.
For example, if JavaScript is used to produce a title tag, there will be two versions of it: one that is loaded in HTML and another that is rendered by JavaScript. This may make it harder for Google to choose which to display in search results.
This is a good technique to inspect the page if you discover that Google is displaying your material unexpectedly in SERPs.
- ### JavaScript Compatibility
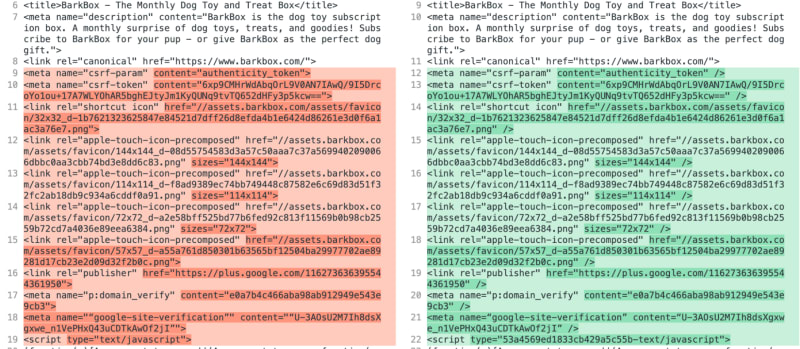
A JavaScript parity test can assist you in identifying differences between the HTML and JavaScript versions of a page.
Right-click within the Elements tab and select Copy > Copy element. This copies the whole JavaScript code of the page. Select the HTML source code with Command or Ctrl+A. Then use a diffchecker to identify any differences between the two.
There will be many injected scripts within the JavaScript code, but the most important items to look for are meta tags, canonicals, indexing tags such as index, and the primary headers and content components.
Emulate Multi-Device Responsiveness
It is critical for current SEO to ensure that your website is responsive, useful, and accessible across numerous devices.
With the device toolbar, Chrome DevTools makes it simple to audit mobile-friendliness.
When you select the "toggle device toolbar" option in the upper left of the panel, the page will be responsive with options at the top.
Choose a device screen size to simulate or set the precise screen size.
Responsive shows the responsiveness of the page, which is a much more effective method than resizing the browser window yourself.
Check that items load and execute properly on mobile devices and that there are no significant variations in content and links as compared to the desktop version.
Site Speed Audits
The ability to audit site speed and performance to uncover any issues that may affect Core Web Vitals and the overall performance of the page is one of the most powerful capabilities in Chrome DevTools.
Lighthouse Audits
Lighthouse may be found in the DevTools window's top navigation bar.
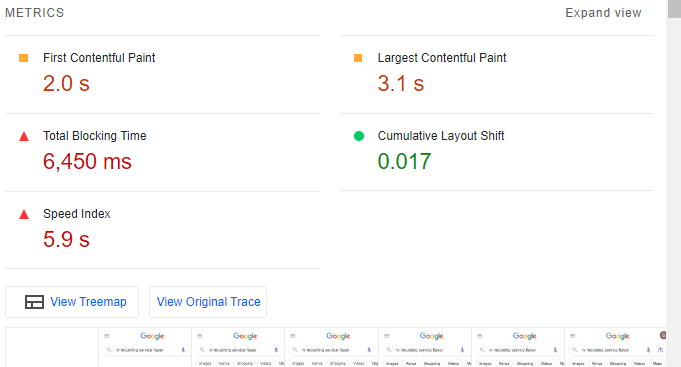
After analyzing the page, Lighthouse will generate a performance score of 100 based on various parameters that Google updates over time. The audit will also show the timing data for the fundamental parameters used to calculate performance scores.
First Contentful Paint, Time To Interactive, Speed Index, Total Blocking Time, Largest Contentful Paint, and Cumulative Layout Shift are now the ones to watch.
Each of these will be color-coded based on their performance, with red indicating poor, orange indicating the need for improvement, and green indicating excellent.
You will also see a visual representation of screenshots depicting the page load, with the elements loaded at each stage. The opportunities list appears below this, and it displays a list of improvements to improve the performance score. The list starts with the biggest saving opportunity, and each point can be enlarged to show more facts and examples of elements that contribute to the score.
Determine Performance Issues
The performance tab is a handy tool for determining the load time of each page element. It can assist you in identifying performance issues that are affecting speed and the user experience.
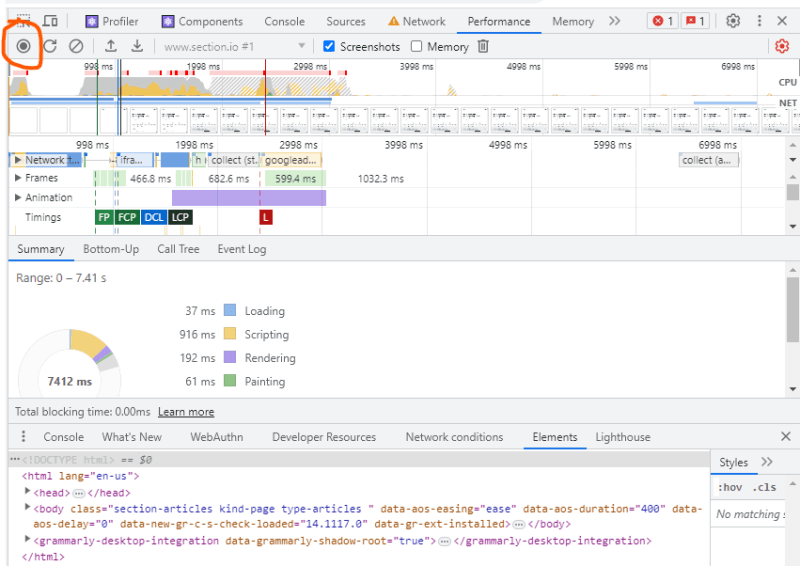
Click "Start profiling and reload page" to record a page reload to test load performance. When CPU and network activity on the page stop, the page will immediately refresh and stop profiling.
You can also experiment with "runtime performance." This captures the page while it is active and you are interacting with it. Click the record button, then navigate the page as if you were a user. When you're finished, hit the stop button to get the performance profile. There are various metrics on the performance tab, but for SEO, we will focus on Filmstrip, Web Vitals, Timings, Experience, and Summary. The filmstrip shows a recording of the page's rendering progress. Hover over each step to see a screenshot from that point in the load. It will show when particular elements load and in what sequence they are added to the page.
Tick the Web Vitals option at the top of the panel to see when each Core Web Vital happens during the load, as well as the timing for each.
Layout shifts are also highlighted in this section. The elements that trigger those shifts are displayed in the Experience bar. Clicking on the occurrence in the Experience bar displays additional information about the score, movement, and affected node.
First Paint (FP): the amount of time it takes for the first pixel to be loaded.
initial Contentful Paint (FCP)the rendering of the initial piece of content
First Meaningful Paint (FMP): the time it takes to offer consumers the first piece of meaningful information When the HTML document has finished loading, the DOMContentLoaded (DCL) event occurs.
Largest Contentful Paint (LCP): the time it takes for the page's largest element to load.
Another thing to consider is the Network Waterfall. It provides essential information about each resource as well as how long it takes to load.
This allows you to detect any resources, such as plugins or scripts, that are slowing down the page.
Areas of Change in Layout
Other content elements may hop around on the page while images and advertising load. This is frequent during page loading, but identifying the specific parts causing these layout alterations might be useful.
There is a Layout Shift Regions option in our console drawer's Rendering panel. This will indicate sections of the page that change layout when content is loaded.
Web Essentials
Core Web Vitals is another option in the Rendering panel. As you interact with the page, an overlay will appear on the screen, providing the main Core Web Vitals metrics and timings for each element.
Performance Analysis
The new Performance Insights panel is comparable to the classic Performance panel in certain ways, but it now offers extra helpful insights.
Click the two arrows along the top and select Performance Insights from the dropdown.
Clicking the measure page load button will reload the page and start recording performance.
You can also enable network and CPU throttling and disable the cache to have a better understanding of how real-world users may perceive the site, which will provide a realistic insight into the performance for first-time visitors.
When the page load is finished, you will see a replay recording of the full load with a visual of the page loading.
You can navigate to various points and identify the various resources and functionality that are loading at each point.
The Performance Insights panel also displays a timeline of each step, with additional insights and details for each stage.
For example, you can see any render-blocking resources, when they occur, and whats causing them.
Find JavaScript Errors
JavaScript issues can prevent content from loading and prevent Googlebot from crawling the site.
Errors will be displayed in the console, and you may create a filter to see only errors.
Clicking the error will take you to the sources page, where you can see where the mistake is occurring in the script.
Sometimes the cautions displayed here aren't something we need to be concerned about as SEO professionals, but when you identify an error, the first thing you should do is check to see whether it affects how the page renders and is indexed by Google.
Code errors indicate that the code is flawed, which can have an influence on usability, which in turn has an impact on user experience and SEO.
SEO mistakes will not effect users, but they may affect how search engines scan the site. They are more harder to recognize because they are not visible to users. This is when the console comes in handy.
conclusion
In conclusion, the audit utilizing Chrome DevTools revealed significant areas for improvement on the website. By addressing performance, accessibility, responsiveness, security, and JavaScript errors, the website's overall user experience can be enhanced, leading to increased user engagement, improved SEO rankings, and a higher likelihood of achieving its business objectives. Regular maintenance and ongoing monitoring are essential to ensuring the website remains in optimal condition and continues to deliver a seamless experience to its visitors.


Top comments (1)
💡 Ready to showcase your coding skills? Join Areon Network's Hackathon and compete for a share of the $500K prize pool. Unleash your creativity at hackathon.areon.network! 🌐🚀 #InnovationUnleashed #AreonHackathon