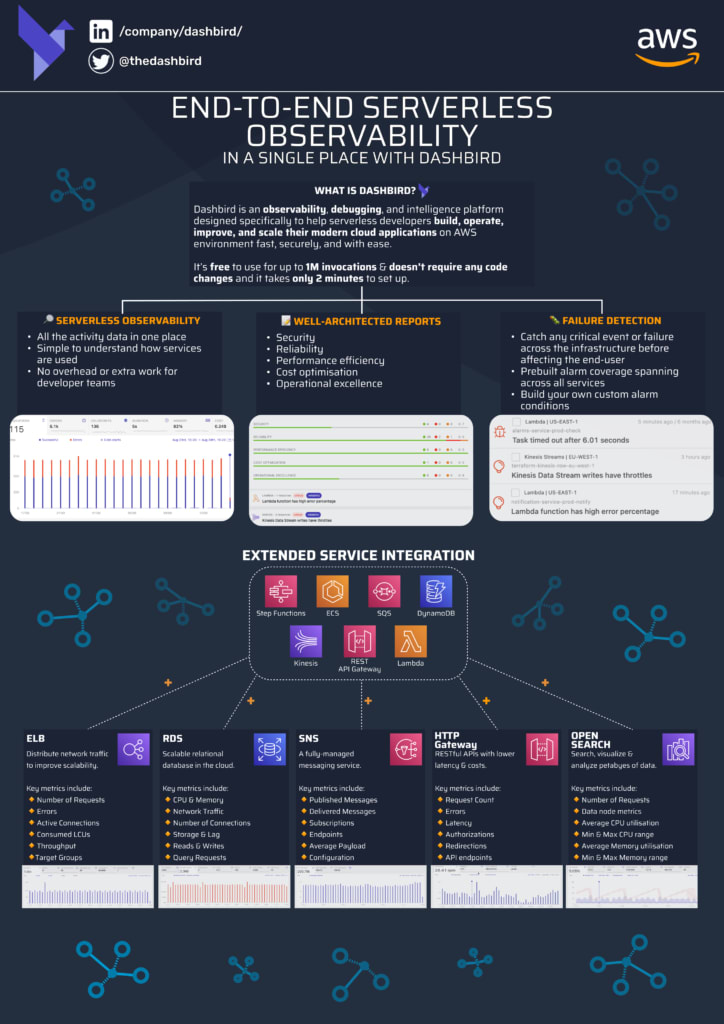
TL;DR: Dashbird launches observability for five new AWS services (ELB, SNS, RDS, OpenSearch, and HTTP API Gateway) to allow for a faster, more secure, and smoother serverless observability experience.
Dashbird, the leading monitoring platform for serverless AWS applications, announces five new AWS integrations. On top of the existing integrations supported, the company is on its way to expanding the platform capabilities to support the broader range of popular cloud services, with more integrations launching later this quarter.
Last year, Dashbird was awarded as the "Cool Vendor in Observability" for its unique, no instrumentation approach and comprehensive 3-pillar approach combining observability, failure management, and posture management.
New AWS services added
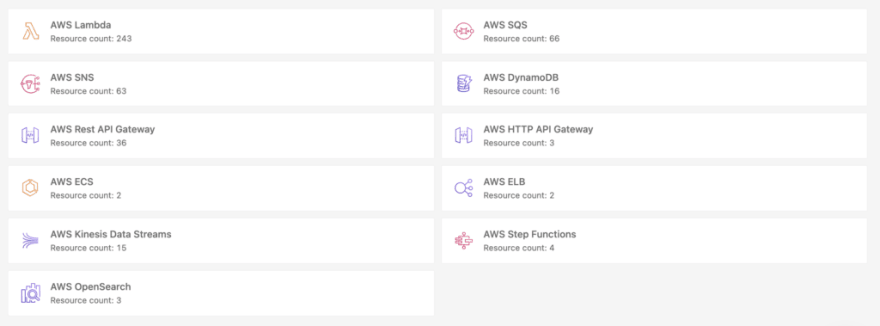
Additionally to AWS Lambda, SQS, DynamoDB, API Gateway, ECS, Kinesis, and Step Functions, you can now get detailed insights and metrics in the Dashbird app for:
- Elastic Load Balancers (ELB)
- Simple Notification Service (SNS)
- Relational Database Service (RDS)
- OpenSearch
- HTTP API Gateway
These services can also be included in Dashbird Resource Groups and are supported by the Well-Architected Lens, Automated failure detection.
Elastic Load Balancers (ELB)
What's included in the dashboard:
- Quickly get insights into the number of requests, errors, active connections, consumed LCUs, throughput and target groups and configuration.
- Detailed monitoring for target groups separately.
- You'll see how many healthy and unhealthy target groups you have. Also, how long it takes for the target group to reply to requests.
- Well-Architected insights and tips: e.g. ELB logs are not enabled, ELB drop invalid headers setting is not configured etc.
Here's the deal, these metrics can help you solve common issues, like unreachable or unhealthy targets. For example, when your targets aren't running or are inaccessible for your ELB, or when you don't have healthy targets left, ELB has to send requests to the remaining unhealthy targets.
Relational Database Service (RDS)
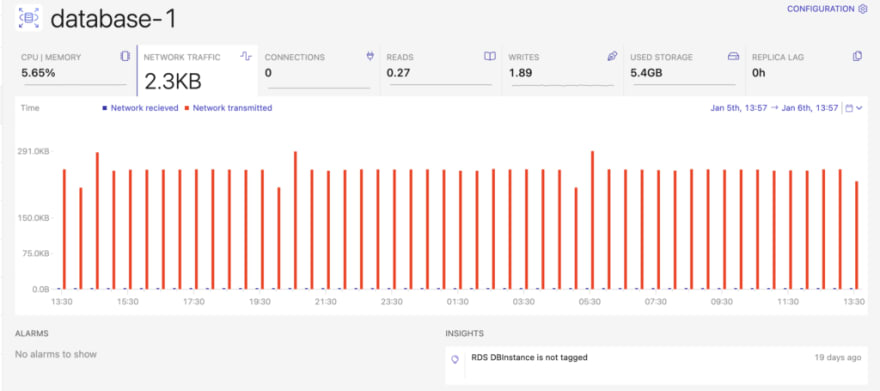
What's included in the dashboard:
- Clusters, instances and proxies.
- Insights per cluster: CPU and memory, network traffic, number of connections, reads, writes, used storage and lag.
- Insights per proxy: database connections, client connections and query requests.
- Well-Architected insights and tips: e.g. clusters/instances/proxies not tagged, enhanced monitoring not enabled, etc.
Put another way, RDS is notoriously slow when used with Lambda because it has been built with the assumption of long-running application servers. With the new insights, you can now see how your RDS clusters behave inside your serverless architecture and act accordingly when they become the bottleneck.
Simple Notification Service (SNS)
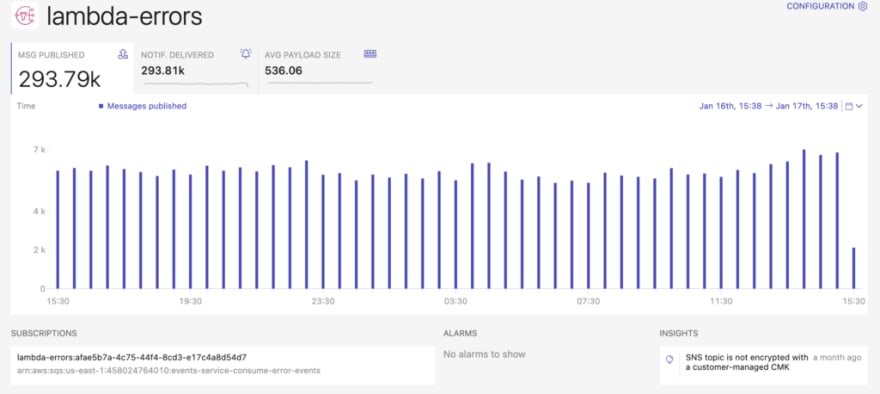
What's on the dashboard:
- How many messages are being published and how many are delivered. This lets you quickly evaluate the overall health of your messages.
- Overall insights on SNS: subscriptions and endpoints.
- Average payload.
- Configuration.
- Well-Architected insights and tips: e.g. SNS topic is not encrypted with a customer-managed CMK, SNS topic is not tagged, SNS topic is abandoned etc.
SNS is part of many serverless architectures because it allows to fan-out multiple tasks to run them on Lambda simultaneously. What does it mean? Knowing how they behave in production gives you the last information you need to optimize the fan-out strategy accordingly.
HTTP API Gateway
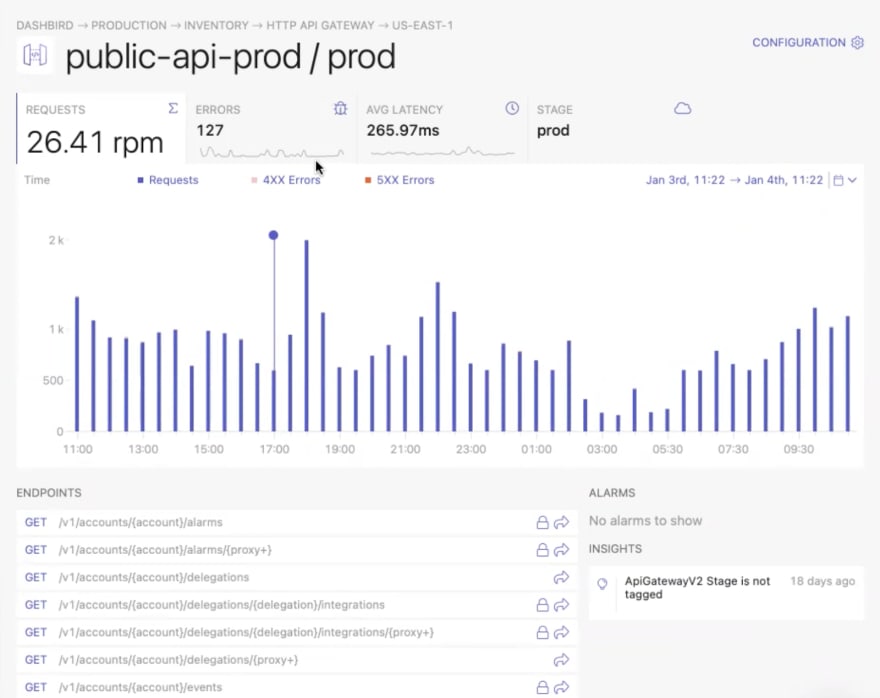
In addition to REST APIs, we now have the functionality to show all HTTP APIs and their resources in a user's AWS account.
What's on the dashboard:
- Detailed view of the request counts, errors, latency, all of the specific API's endpoints, authorizations, and redirections.
- Well-Architected insights and tips: e.g. Stage not tagged.
The HTTP version of API Gateway is a bit more low-level than the REST version, but this enables you to build APIs that don't follow the REST approach more readily. AsyncAPI or GraphQL comes to mind here. With this new integration, you don't have to decide between "REST with insights" or "non-REST without insights" anymore.
OpenSearch
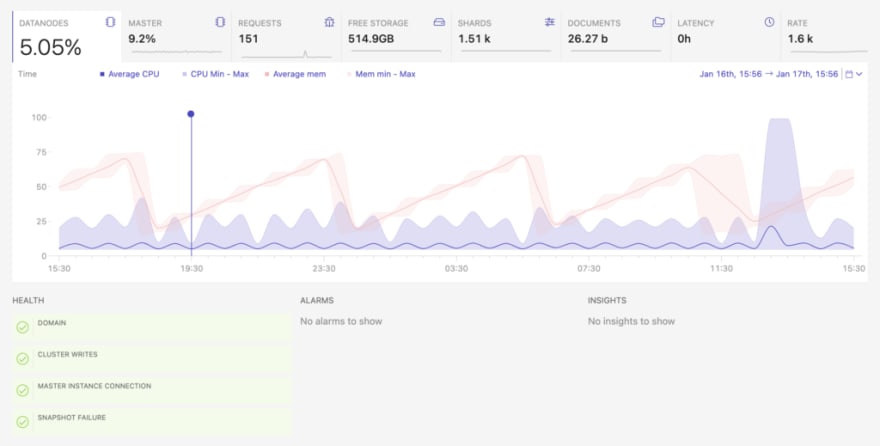
The Dashbird OpenSearch integration includes all available metrics from CloudWatch and configuration data from AWS. The dashboard view visualizes the critical information in a quickly digestible and clear way.
On the dashboard:
- Datanodes (Average CPU, Minimum -- Maximum CPU range, Average memory utilisation, Minimum and Maximum memory utilisiation)
- Master
The integration also includes 20 best practice checks and prebuilt alarms continuously monitored for out-of-the-box.
OpenSearch is AWS' community-driven open-source fork of Elasticsearch and Kibana. For data-heavy applications that require users to search all the time, this service is a must. So, to keep things running at an acceptable performance, Dashbirds new integration is here to help.
Why Serverless developers use Dashbird?
At Dashbird, we understand that the core idea and value of serverless is to focus on the customer and the ability to avoid undifferentiated heavy lifting. That's what we provide. We give the focus back to developers to only think about the end-customer,and to not be distracted by debugging and alarm management or to worry about whether something is working or not.
Dashbird increases reliability and iteration speed. Developers have said they're able to work up to 80% faster with the aid of Dashbird alerting them when something is wrong and telling them the ins and outs of their system. And helping them achieve industry best practices, with an effect on cost optimization, performance-optimized, and the overall management of the posture of your infrastructure.
- No code changes- No credit card required- Forever free for small infrastructures (1M Lambda executions per month)- Simple 2-minute set up- Get access to all premium features- Start debugging, receiving automated alerts, and working with your data immediately
Further reading:
Dashbird explained: the why, what and how





Top comments (0)