This is really a follow-on to my post from last week where I connected an Arduino with a temperature and humidity sensor to QuestDB.
It’s one thing to send data to your database, but being able to visualize that data is the next logical step. So let’s dive right in to doing that.
QuestDB is rather new, and hence we haven’t completed our Grafana Data Source Plugin yet, so I wanted to make a quick dashboard to show the incoming temperature/humidity data (and you’ll see just how awful the sensor really is). To do this, I chose Node-Red because, well, it seems the obvious choice!
Building the Nodes:
As you can see, it uses only a few nodes, so I’ll walk through them one by one.
The initial node is an injector node that fires at a regular, configurable interval. Mine fires every 10 seconds just to keep from being too noisy. It triggers the SetQuery node which builds the query:
var q = {}
q["query"] = "select temp_c, humidity, timestamp from iot where timestamp > (systimestamp() - 5000000)"
msg.payload = q
return msg;
I set the payload to a query, in this case, I’m getting the temperature and the humidity for the past 5 seconds (remember, we are dealing with microsecond timestamps, so 5 seconds is 5M microseconds). I then send that query, as the payload, to an http request node that I’ve called Query QuestDB. I’ve set the host to be my local machine, the URL to the query API endpoint, and I append the incoming msg.payload to the URL.
The query returns a a JSON string, so I’ll need to run it through a JSON Node to turn it into a JSON Object. I then send the result of that JSON-parsing to 2 additional nodes, one for temperature and one for Humidity. After the JSON Parsing, I get an object back that has several things in it I want to go through.
The first thing to note is that the payload contains a query field that shows the query I executed. Cool! Next, I get a columns field that is an array with an entry for each column if data I am getting back. Since I queried for temp_c, humidity and timestamp I would expect this array to have 3 elements in it, and indeed it does. It also tells me, in each element, the name, and the type of value it has returned which is helpful information.
Finally, there is a dataset field which contains a array of arrays with my data that I requested. Since I requested 5 seconds worth of data, and, if you remember from the previous post, I was sending data once per second, I get back an array with 5 arrays in it, one for each second. By expanding these arrays, I see that I have gotten 2 doubles and a timestamp in each one corresponding to what the columns field told me I would get. Nice! So all that’s left is to send that data to some dashboard elements. Well, almost.
var f = {}
f.topic = "Temperature ºC"
f.payload = msg.payload.dataset[msg.payload.dataset.length-1][0]
f.timestamp = msg.payload.dataset[msg.payload.dataset.length-1][2]
return f
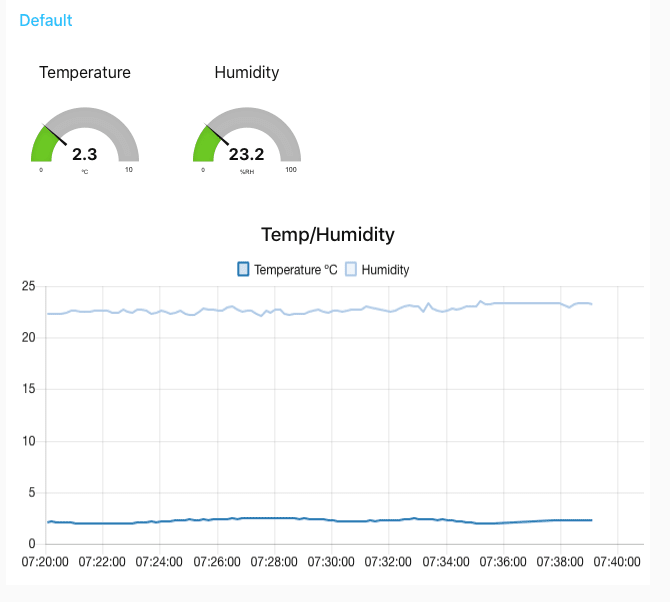
For the Set Temp node, I pull the last element out of the dataset, and grab the temperature value and the timestamp value. I then send those on, as the payload, to the actual Dashboard elements. I do the exact same thing for the Set Humidity Node. By dragging in the dashboard nodes, Node-Red automatically sets up a web dashboard with these elements, and I can go to it and see my new dashboard:
Now that you can actually visualize the data, you can see how awful the data really is! There is no way it’s 2.3º C in my office right now! I guess my next task is to get a real temperature and humidity sensor set up to send more accurate data! Lucky for me, I have a few of those lying around, so that will have to be my next project I guess.
We’re Done Here
As always, please visit our GitHub and give us a star if you think this was useful! You can follow me on twitter, but also follow QuestDB!


Top comments (0)