SenseDeep is a fast, in-depth Serverless monitoring solution so you can troubleshoot your Serverless applications in real-time.
If you need to quickly see:
- Why are Lambda functions failing?
- Which functions cost the most?
- Which functions are incurring cold starts and spoiling the user experience?
- What should be the provisioned concurrency for your functions?
and other such questions, then SenseDeep Lambda troubleshooting can assist.
SenseDeep Lambda troubleshooting has many new capabilities including:
- All new dashboard with graphs and gauges
- Detailed Lambda monitoring, metrics and management
- Enhanced log viewer
- Revamped and optimized UI
Lambda Monitoring and Management
SenseDeep now has a completely new Lambda monitoring and management capability. This includes tracking and monitoring Lambda functions and metrics. SenseDeep tracks individual function invocations and aggregates metrics to provide a high level view of your Lambda-based services.
SenseDeep is unique in how it accesses Lambda metrics and invocation logs. SenseDeep is the only service to access your AWS Lambda and CloudWatch logs directly in AWS without any intermediate processing
or double storage or buffering. This provides the lowest possible latency when presenting critical Lambda results for your viewing.
Lambda Inventory
SenseDeep captures a full inventory of your serverless functions from AWS Lambda.
SenseDeep presents all Lambda functions with detailed stats and metrics. This includes: the number of invocations, cold starts, function duration, memory consumption, function errors and the estimated cost per month.
Lambda Drill Down
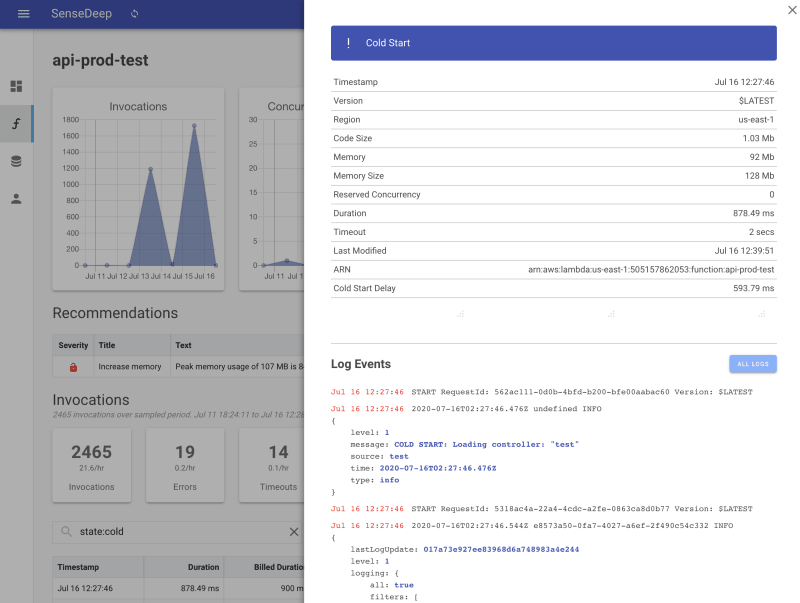
Selecting a specific Lambda function from the function list will display detailed graphs and metrics for the function.
The graphs shows function performance including the number of invocations, concurrent executions, errors and the average duration. You can select the graphed period to be per hour, day, week, month or custom period.
Below the graphs are the numerics for the most recent period. These statistics include the number of cold starts and the estimated cost for the function per month.
Below the numeric widgets is a searchable list of function invocations with the most recent invocations at the top. Click on any invocation to display the full invocation details.
Invocation Details Exposed
The function invocation details make it easy and quick to pin-point errors and important metrics.
The function version, timeout, code size and ARN are presented at the top. Below that, the exact invocation logs are displayed.
The logs are color-coded and JSON fragments are expanded for clarity. You can click on the "Logs" button to immediately jump to the full CloudWatch log at the exact location of the invocation. From there, you can see previous and subsequent events in context.
New SenseDeep Dashboard
The new dashboard is a highly customizable presentation of widgets to display your most important serverless metrics. It displays view and Lambda widgets, graphs and gauges.
View widgets can be resized and reordered to suit your preference. Dashboards are saved per-organization and personal dashboards are saved for your personal organization.
A side-panel provides a gallery of available widgets. Widgets can be dragged to and from the gallery as desired. When a view is dismissed, it is returned to the gallery.
At the top of the dashboard, three icons are provided for:
- Soft and hard reset of the dashboard layout
- Add a new view card for an AWS log group
- Display the widget gallery
Enhanced Log Viewer
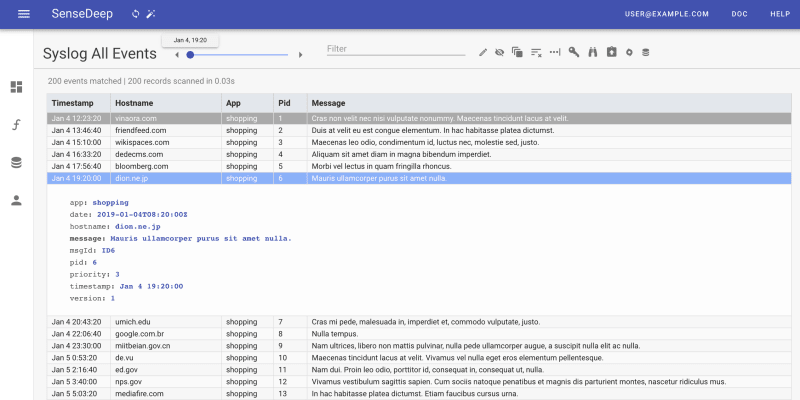
The SenseDeep viewer has been enhanced in some important ways.
There are several new icons:
The first icon displays the advanced view edit slide-out panel. The second icon is new and will reveal or hide Lambda service related messages. This permits you to focus on application only log messages by hiding the frequent AWS Lambda start and end log events. The other new icon is a quick link to edit the underlying log configuration.
Optimized UI
The entire SenseDeep UI has been revamped and refined. Edit panels now employ a slide-out pattern to simplify navigation and help you retain context. Data table presentation has been refined and optimized and dozens of small UI improvements add up to a significant improvement in usability.
View management has also been simplified and made more automatic. Rather than explicitly creating views for logs, the views are transparently created as required when a log or lambda is enabled for monitoring.
The log list has been unified and simplified. A single log list is now ordered by most recent invocations.
Lowest Latency
SenseDeep is offers the lowest latency in detecting and presenting Lambda invocations and changes. Developers need immediate results when testing, debugging and monitoring serverless services.
Whereas most other serverless monitoring services wait minutes to receive and display Lambda invocation results, SenseDeep is unique in its ability to display results in 15-30 seconds after invocation.
This directly translates into increased developer productivity.
unique in how it accesses Lambda metrics and invocation logs. SenseDeep is the only service to access your AWS Lambda and CloudWatch logs directly in AWS without any intermediate processing or double storage or buffering. This provides the lowest possible latency when presenting critical Lambda results for your viewing.
Summary
SenseDeep is the fastest Serverless monitoring and management service. It is unique in that it uses direct access from your browser to AWS rather than duplicating Lambda and log data in a 3rd party solution.
SenseDeep will display Lambda results in real-time with full metrics, analysis and application log data in context. SenseDeep is the fastest serverless debug service.
Getting Started
There is nothing to install. Just navigate your browser to: https://app.sensedeep.com/
To learn more about SenseDeep and how to use the app, please read the documentation at: https://www.sensedeep.com/doc/.
Please let us know what you think, we thrive on feedback. dev@sensedeep.com.


Top comments (0)