
Sometimes your app works, but you want to increase performance by boosting its throughput or reducing latency. Other times, you just want to know how code behaves at runtime, determine where the hot spots are, or figure out how a framework operates under the hood.
This is a perfect use case for profilers. They offer a bird’s eye view of arbitrarily large execution chunks, which helps you see problems at scale.
Many people believe that they don’t need to learn how to profile as long as they don’t write high-load applications. In the example, we’ll see how we can benefit from profiling even when dealing with very simple apps.
Example application
Let’s say we have the following program:
import java.io.IOException;
import java.nio.file.Files;
import java.nio.file.Path;
import java.nio.file.Paths;
import java.util.*;
import java.util.concurrent.TimeUnit;

public class CountEvents {

    public static int update(Deque<Long> events, long nanos, long interval) {
        events.add(nanos);
        events.removeIf(aTime -> aTime < nanos - interval);
        return events.size();
    }

    public static void main(String[] args) throws IOException {
        long start = System.nanoTime();
        int total = 100_000;
        long interval = TimeUnit.MILLISECONDS.toNanos(100);
        int[] count = new int[total];

        Deque<Long> collection = new ArrayDeque<>();
        for (int counter = 0; counter < count.length; counter++) {
            count[counter] = update(collection, System.nanoTime(), interval);
            Path p = Paths.get("./a/b");
            Files.createDirectories(p);
        }
        long spent = System.nanoTime() - start;

        //noinspection OptionalGetWithoutIsPresent
        System.out.println("Average count: " + (int) (Arrays.stream(count).average().getAsDouble()) + " op");
        System.out.println("Spent time: " + TimeUnit.NANOSECONDS.toMillis(spent) + " ms");
    }
}
The program repeatedly tries to create a path in the file system using createDirectories() from NIO2. Then we measure the throughput using an improvised benchmark.
Every time a task runs, the benchmark logic stores the current timestamp to a collection and removes all timestamps that point to a time earlier than the current time minus some interval. This makes it possible to find out how many events occurred during this time interval by just querying the collection. This benchmark is supposed to help us evaluate the performance of the createDirectories() method.
When we run the program, we find that the figures are suspiciously low:
Average count: 6623 op
Spent time: 1462 ms
Let’s profile it and see what’s wrong.
Get a snapshot
I’m using IntelliJ Profiler because it is nicely integrated with the IDE and removes the hassle of setting everything up. If you don’t have IntelliJ IDEA Ultimate, you can use another profiler. In this case, the steps might be a little bit different.
First, we need to collect profiling data, which is also referred to as a snapshot. At this stage, the profiler runs alongside the program gathering information about its activity. Profilers use different techniques to achieve this, such as instrumenting method entries and exits. IntelliJ Profiler does that by periodically collecting the stack information from all threads running in the app.
To attach the profiler from IntelliJ IDEA, choose a run configuration that you would normally use to run the application, and select Profile from the menu.

When the app has finished running, a popup will appear, prompting us to open the snapshot. If we dismiss the popup by mistake, the snapshot will still be available in the Profiler tool window.
Let’s open the report and see what’s in it.
Analyze the snapshot
The first thing we see after opening the report is the flame graph. This is essentially a summary of all sampled stacks. The more samples with the same stack the profiler has collected, the wider this stack grows on the flame graph. So, the width of the frame is roughly equivalent to the share of time spent in this state.
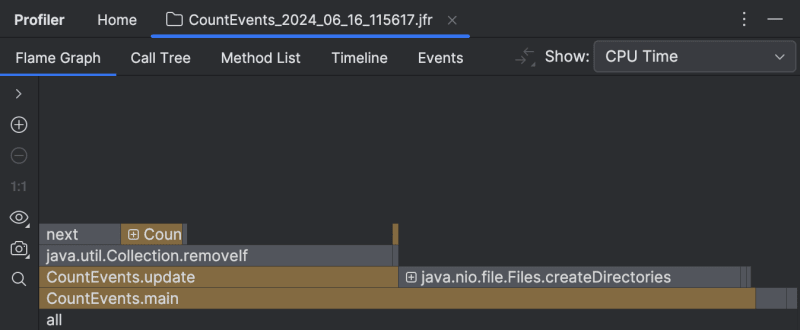
To our surprise, the createDirectories() method did not account for the most execution time. Our homemade benchmark took about the same amount of time to execute!
Furthermore, if we look at the frame above, we see that this is primarily because of the removeIf() method, which accounts for almost all the time of its caller, update().

This clearly needs some looking into.
Tip:
Alongside traditional tools like the the flame graph, IntelliJ Profiler provides performance hints right in the editor, which works great for quick reference and simple scenarios:

Optimize the benchmark
Seems like the code responsible for removing events from the queue is doing extra work.
Since we’re using an ordered collection, and events are added in chronological order, we can be sure that all elements subject for removal are always at the head of the queue. If we replace removeIf() with a loop that breaks once it starts iterating over events that it is not going to remove, we can potentially improve performance:
// events.removeIf(aTime -> aTime < nanos - interval);
while (events.peekFirst() < nanos - interval) {
    events.removeFirst();
}
Let’s change the code, then profile our app once again and look at the result:

The overhead from the benchmark logic is now minimal as it should be, and the createDirectories() frame now occupies approximately 95% of the entire execution time.
The improvement is also visible in the console output:
Average count: 14788 op
Spent time: 639 ms
Native profiling
Having solved the problem in the benchmark, we could stop here and pat ourselves on the back. But what’s going on with our createDirectories() method? Is it too slow?
There seems little room for optimization here, since this is a library method, and we don’t have control over its implementation. Still, the profiler can give us a hint. By expanding the folded library frames, we can inspect what’s happening inside.

This part of the flame graph shows that the main contributor to the execution time of createDirectories() is sun.nio.fs.UnixNativeDispatcher.mkdir0. A large portion of this frame has nothing on top of it. This is referred to as method’s self-time and indicates that there is no Java code beyond that point. There might be native code, though.
Since we are trying to create a directory, which requires calling the operating system’s API, we might expect mkdir‘s self-time to be dominated by native calls. UnixNativeDispatcher in the class name seems to confirm that.
Let’s enable native profiling (Settings | Build, Execution, Deployment | Java Profiler | Collect native calls):
Rerunning the application with native profiling enabled shows us the full picture:

Here’s the catch. The documentation for the createDirectories() method says:
Creates a directory by creating all nonexistent parent directories first. Unlike the createDirectory method, an exception is not thrown if the directory could not be created because it already exists.
The description is valid from the Java perspective, as it doesn’t raise any Java exceptions. However, when attempting to create a directory that already exists, exceptions are thrown at the operating system level. This leads to a significant waste of resources in our scenario.
Let’s try to avoid this and wrap the call to createDirectories() in a Files.exists() check:
Path p = Paths.get("./a/b");
if (!Files.exists(p)) {
    Files.createDirectories(p);
}
The program becomes lightning fast!
Average count: 50000 op
Spent time: 87 ms
It is now about 16 times faster than it originally was. This exception handling was really expensive! The results may differ depending on the hardware and the environment, but they should be impressive anyway.
Snapshots’ diff
If you are using IntelliJ Profiler, there is a handy tool that lets you visually compare two snapshots. For a detailed explanation and steps, I recommend referring to the documentation.
Here’s a brief rundown of the results the diff shows:

Frames missing from the newer snapshot are highlighted in green, while the new ones are colored red. If a frame has several colors, this means the frame is present in both snapshots, but its overall runtime has changed.
As visible in the screenshot above, the vast majority of operations originally performed by our program were unnecessary, and we were able to eliminate them. CountEvents.update() is completely green, which means our first change resulted in near-complete improvement in the method’s runtime. Adding Files.exists() was not a 100% improvement, but it effectively removed createDirectories() from the snapshot, only adding 60 ms to the program runtime.
Conclusion
In this scenario, we used a profiler to detect and fix a performance problem. We also witnessed how even a well-known API may have implications that seriously affect the execution times of a Java program. This shows us why profiling is a useful skill even if you are not optimizing for millions of transactions per second.
In the coming articles we’ll consider more profiling use cases and techniques. Stay tuned!


Top comments (0)