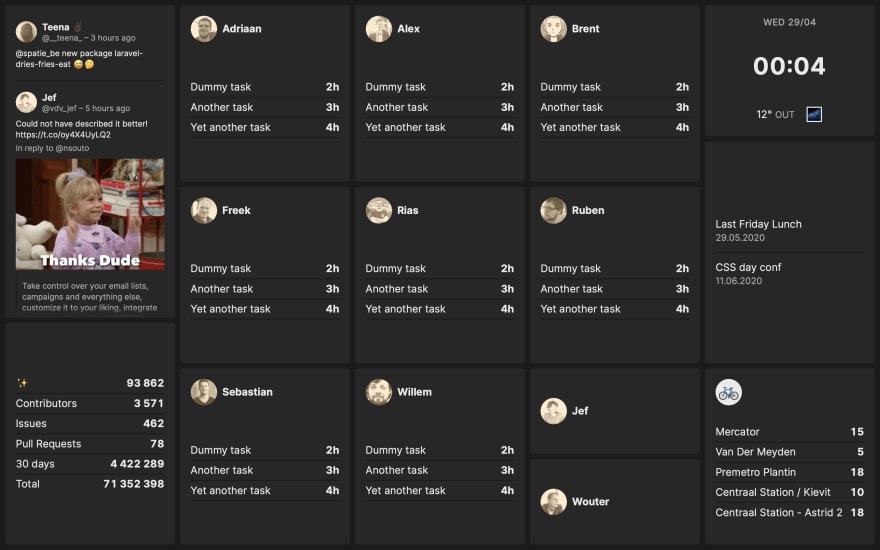
At Spatie we have a TV screen against the wall that displays a dashboard. This dashboard displays the tasks our team should be working on, important events in the near future, which tasks each of our team members should be working on, what music they are listening to, and so on. Here's what it looks like:
This dashboard is built using our laravel-dashboard package. It will allow you to built a similar dashboard in no time.
In this blogpost I'd like to walk you through both the dashboard and the package.
History
We've had a dashboard at Spatie for quite some time now. Before our current Laravel-based one we used Dashing, a framework to quickly build dashboards. The framework was created by the folks at Shopify and uses Ruby under the hood.
When I first built our dashboard, a few years ago, we were at a crossroads with our company. There wasn't much momentum in the PHP world and we were toying with the idea of switching over to Ruby. The idea was that by playing with Dashing we would get some experience with the language. Then Composer and Laravel happened and we decided to stick with PHP (and given the current state of PHP ecosystem we don't regret that choice at all).
When support for Dashing had officially stopped in 2016, I thought it was a good time to completely rebuild the dashboard using Laravel and Vue.
Every year, my team I iterated further on the dashboard. It gained some more tiles, support for Laravel Echo was added. a cleaner layout powered by Tailwind,...
The dashboard always made as a complete Laravel app. In the back of my mind I always had the plan to make the core dashboard and individual tiles available as packages. The big hurdle to take was that the stack is kinda complicated: in order to create a tile we'd need PHP classes to fetch data, create events, and have Vue component to display stuff.
This year we moved away from WebSocket and Vue in favour of Laravel Livewire. Using Livewire has some drawbacks, but a big advantage is that packaging up tiles now is much simpler. Instead of one big Laravel app, the dashboard no consist of a core package and a collection a tile packages.
The tiles
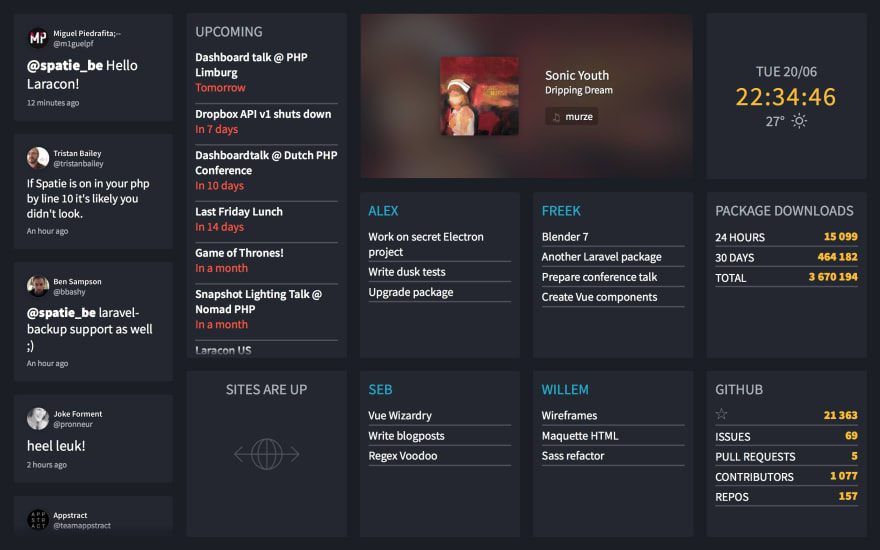
Let's take a closer look at what the dashboard is displaying. The configured dashboard from the above screenshot has the following tiles:
- A Twitter tile that shows all mentions of quotes of
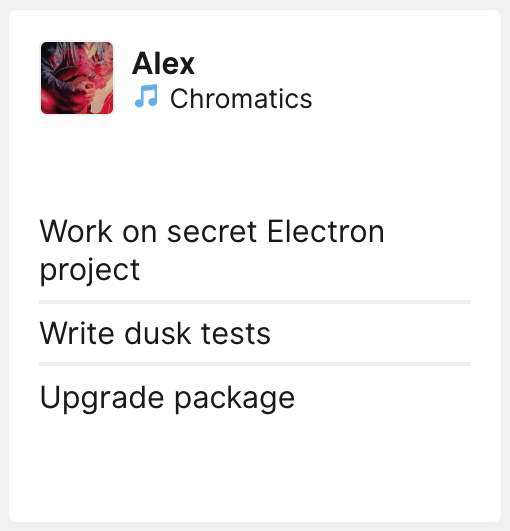
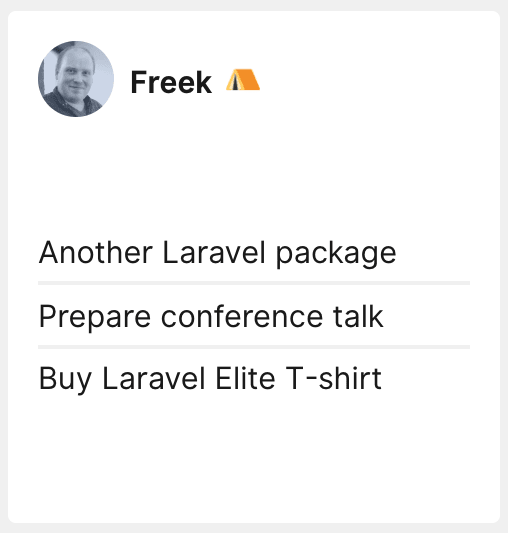
@spatie_be. Under the hood this is powered by our Twitter Labs package. - There's a dedicated tile for each member of our team. Each tile displays the tasks for that member for the current week. Those tasks are fetched from a few markdown files in a private repo on GitHub. There's a little bit more to this tile. More on that later.
- Some statistics of our numerous public repositories on GitHub. This data is coming from the GitHub and the Packagist API
- A team calendar that pulls in events from a Google Calendar.
- A clock with the current date. and some weather conditions, retrieved from the Open Weather Map API.
- In our home city, Antwerp, there is a shared biking system called Velo. The bike tile shows how many bikes there are available in the nearest bike points near our office.
To help everyone to stay "in the zone" we bought the entire team Bose QuietComfort headphones. The dashboard displays the current track for each team member on his team member tile. The avatar will be replaced by the artwork of the album. We leverage the API of last.fm to get this info.
The team member tile will also display a little crown when it's someone's birthday?
With the ongoing Corona pandemic our team works 100% remotely. In normal times team members also regularly work from home. When not working in the office for a day we have the habit of setting our status in Slack to "Working from home". When a team member sets that status in Slack we'll display a nice little tent emoji.
High level overview
After the browser displays the dashboard for the first time we'll never refresh the page again. Livewire is used to refresh the tiles. Doing it this way will avoid having to refresh the page and in turn, avoid flashing screens.
Most tiles consist of these functionalities:
- an artisan command that fetches data and stores it somewhere. The artisan commands should be scheduled so that data is fetched periodically.
- a Livewire component: this class accepts various props that can be used to configure the tile. It should at least accept a
positionprop. Livewire components can re-render themselves. Livewire does this by re-rendering the html on the server and update the changed parts in the DOM using morphdom. - a Blade view to render the component.
The base laravel-dashboard package provides a Tile model that tiles can use to store data. Using the Tile model isn't required, tiles can choose themselves how they store and retrieve data.
A tile is entirely written in PHP. This makes it easy to create new tiles. It's also easy to package up tiles. Nearly all our tiles are available as packages:
- Time and Weather: displays the current time and weather at your location
- Calendar: displays events that are on a Google Calendar
- Twitter: displays mentions on Twitter
- Oh Dear Uptime: displays sites that are detected as down by Oh Dear
- Belgian Trains: displays real-time info on Belgian trains
- Velo: displays the status of Velo, the Antwerp bike sharing system.
Creating a dashboard and positioning tiles
Our company dashboard, which you can find in this repo, is a Laravel app which makes use of laravel-dashboard package. A dashboard is simply a route that points to a view.
// in routes/web.php

Route::view('/', 'dashboard');
Here's the content of the dashboard, slightly redacted for brevity.
<x-dashboard>
    <livewire:twitter-tile position="a1:a14" />

    <livewire:team-member-tile
        position="b1:b8"
        name="adriaan"
        :avatar="gravatar('adriaan@spatie.be')"
        birthday="1995-10-22"
    />

    <livewire:team-member-tile
        name="freek"
        :avatar="gravatar('freek@spatie.be')"
        birthday="1979-09-22"
        position="b9:b16"
    />

    {{-- other tile members removed for brevity --}}

    <livewire:calendar-tile position="e7:e16" :calendar-id="config('google-calendar.calendar_id')" />

    <livewire:velo-tile position="e17:e24" />

    <livewire:statistics-tile position="a15:a24" />

    <livewire:belgian-trains-tile position="a1:a24"/>

    <livewire:oh-dear-uptime-tile position="e7:e16" />

    <livewire:time-weather-tile position="e1:e6" />
</x-dashboard>
This view is quite simple. You have to use the x-dashboard Blade component. Behind the scenes, this component will pull in all necessary css and JavaScript used by Livewire.
Inside x-dashboard you can use a livewire tile component.
A tile can be positioned by passing coordinates to the position prop.
You should image the dashboard as an excel like layout. The columns are represented by letters, the rows by number. You can pass a single position like a1. The first letter, a, represent the first column. The 1 represents the first row. You an also pass ranges. Here are a few examples.
-
a1: display the tile in the top left corner -
b2: display a tile in the second row of the second column -
a1:a3: display a tile over the three first rows of the first column -
b1:c2: display the tile as a square starting at the first row of the second column to the second row of the third column
The dashboard is being rendered using css grid. Behind the scenes, these coordinates will be converted to grid classes. The grid will grow automatically. If a c is the "highest" letter used on the dashboard, it will have 3 columns, if a e is used on any tile, the dashboard will have 5 columns. The same applies with the rows.
The calendar tile
Now that you know how the dashboard works in broad lines, let's go in details how some of the tiles work.
Here is how the calendar tile looks like.
To fetch data, this tile uses our google-calendar package.
Here is the command that fetches the data:
namespace Spatie\CalendarTile;

use Carbon\Carbon;
use DateTime;
use Illuminate\Console\Command;
use Spatie\GoogleCalendar\Event;

class FetchCalendarEventsCommand extends Command
{
    protected $signature = 'dashboard:fetch-calendar-events';

    protected $description = 'Fetch events from a Google Calendar';

    public function handle()
    {
        $this->info('Fetching calendar events...');

        foreach (config('dashboard.tiles.calendar.ids') ?? [] as $calendarId) {
            $events = collect(Event::get(null, null, [], $calendarId))
                ->map(function (Event $event) {
                    $sortDate = $event->getSortDate();

                    return [
                        'name' => $event->name,
                        'date' => Carbon::createFromFormat('Y-m-d H:i:s', $sortDate)->format(DateTime::ATOM),
                    ];
                })
                ->unique('name')
                ->toArray();

            CalendarStore::make()->setEventsForCalendarId($events, config('google-calendar.calendar_id'));
        }

        $this->info('All done!');
    }
}
Most of the tiles that we create also have a Store class. This store class is responsible for storing and retrieving data. When retrieving the data, it also formats it so it's easily consumable for the component.
namespace Spatie\CalendarTile;

use Carbon\Carbon;
use Illuminate\Support\Collection;
use Spatie\Dashboard\Models\Tile;

class CalendarStore
{
    private Tile $tile;

    public static function make()
    {
        return new static();
    }

    public function __construct()
    {
        $this->tile = Tile::firstOrCreateForName('calendar');
    }

    public function setEventsForCalendarId(array $events, string $calendarId): self
    {
        $this->tile->putData('events_' . $calendarId, $events);

        return $this;
    }

    public function eventsForCalendarId(string $calendarId): Collection
    {
        return collect($this->tile->getData('events_' . $calendarId) ?? [])
            ->map(function (array $event) {
                $carbon = Carbon::createFromTimeString($event['date']);

                $event['date'] = $carbon;
                $event['withinWeek'] = $event['date']->diffInDays() < 7;
                $event['presentableDate'] = $this->getPresentableDate($carbon);

                return $event;
            });
    }

    public function getPresentableDate(Carbon $carbon): string
    {
        if ($carbon->isToday()) {
            return 'Today';
        }

        if ($carbon->isTomorrow()) {
            return 'Tomorrow';
        }

        if ($carbon->diffInDays() < 8) {
            return "In {$carbon->diffInDays()} days";
        }

        if ($carbon->diffInDays() <= 14) {
            return "Next week";
        }

        $dateFormat = config('dashboard.tiles.calendar.date_format') ?? 'd.m.Y';

        return $carbon->format($dateFormat);
    }
}
If you are not as pragmatic as I am, add are a devout follower of the Single Responsibility principle, you can move the responsibilities to separate classes.
The events in the store are retrieved by the CalendarTileComponent which is a Livewire component
namespace Spatie\CalendarTile;

use Livewire\Component;

class CalendarTileComponent extends Component
{
    /** @var string */
    public $calendarId;

    /** @var string */
    public $position;

    /** @var string|null */
    public $title;

    /** @var int */
    public $refreshInSeconds;

    public function mount(string $calendarId, string $position, ?string $title = null, int $refreshInSeconds = 60)
    {
        $this->calendarId = $calendarId;

        $this->position = $position;

        $this->title = $title;

        $this->refreshInSeconds = $refreshInSeconds;
    }

    public function render()
    {
        return view('dashboard-calendar-tile::tile', [
            'events' => CalendarStore::make()->eventsForCalendarId($this->calendarId),
            'refreshIntervalInSeconds' => config('dashboard.tiles.calendar.refresh_interval_in_seconds') ?? 60,
        ]);
    }
}
This component accepts the calendar id of which the events should be displayed. It also accepts the position where the title should be displayed, a title, and a frequency at which the component should be re-rendered.
Next, let's take a look at the Blade view.
<x-dashboard-tile :position="$position" :refresh-interval="$refreshIntervalInSeconds">
    <div class="grid {{ isset($title) ? 'grid-rows-auto-auto gap-2' : '' }} h-full">
        @isset($title)
            <h1 class="uppercase font-bold">
                {{ $title }}
            </h1>
        @endisset

        <ul class="self-center divide-y-2 divide-canvas">
            @foreach($events as $event)
                <li class="py-1">
                    <div class="my-2">
                        <div class="{{ $event['withinWeek'] ? 'font-bold' : '' }}">{{ $event['name'] }}</div>
                        <div class="text-sm text-dimmed">
                            {{ $event['presentableDate'] }}
                        </div>
                    </div>
                </li>
            @endforeach
        </ul>
    </div>
</x-dashboard-tile>
This view simply renders the passed events to HTML. You probably noticed that a x-dashboard-tile Blade component is used here. That DashboardTileComponent is part of the base laravel-dashboard package. That class will, amongst other things, convert an the excel like position notation like a1:a14 to a css grid style like: grid-area: 1 / 1 / 15 / 2;.
Let's take a look at the Blade view of Dashboard tile component.
<div
    style="grid-area: {{ $gridArea }};{{ $show ? '' : 'display:none' }}"
    class="overflow-hidden rounded relative bg-tile"
    {{ $refreshIntervalInSeconds ? "wire:poll.{$refreshIntervalInSeconds}s" : ''  }}
>
    <div
        class="absolute inset-0 overflow-hidden p-4"
        @if($fade)
            style="-webkit-mask-image: linear-gradient(black, black calc(100% - 1rem), transparent)"
        @endif
    >
        {{ $slot }}
    </div>
</div>
Here you can see that $refreshIntervalInSeconds is use to add Livewire's wire:poll directive. Adding this directive will result in the automatic re-rendering of the component.
In case you're not familiar with Blade components, that $slot variable contains all html that's between the x-dashboard-tile tags.
The Twitter tile
The Twitter tile is quite fun. Here is how it looks like:
It displays tweets in (near) real-time that contain a certain string. Under the hood this tile is powered by our Twitter Labs package. It uses the filtered stream Twitter API and ReactPHP to listen for tweets.
To starting listening for incoming tweets you must execute this command:
php artisan dashboard:listen-twitter-mentions
This command will never end. In production should probably want to use something like Supervisord to keep this this task running and to automatically start it when your system restarts.
The command in the config of the tile in the dashboard config file, you can specify to which tweets it should listen for. In our dashboard we are listening for @spatie_be, spatie.be and github.com/spatie.
Whenever a tweet containing any of those strings comes in, we store the tweet in the Tile model. The TwitterComponent will read the tweets stored in that tile model. The component is re-rendered every five seconds, so we have a (near) real time feed.
You can even use this tile multiple times to create a tweet wall in no time. Here's a video in which I demonstrate how you can do that.
The Oh Dear uptime tile
Oh Dear is an app I've built to monitor the uptime of sites. Most competitors only monitor the homepage. Oh Dear crawls your sites and can also alert you when your site contains a broken link or mixed content.
Oh Dear has a beautiful API to work with. It also provides a package to easily consume web hooks sent by Oh Dear.
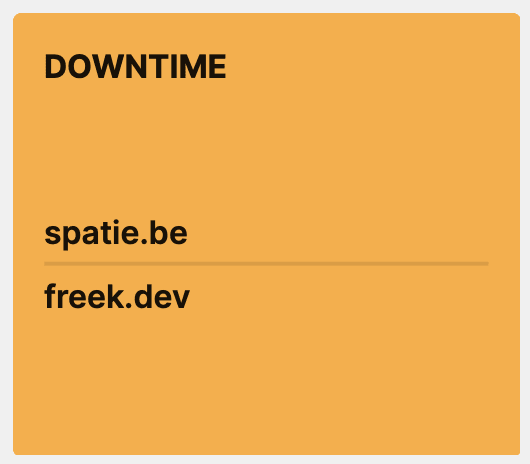
All sites built and managed by our team are monitored by Oh Dear. The Oh Dear Uptime Tile displays all sites that are down. Here's how it looks like when sites are down.
This tile is only displayed when sites are down. The tile component class accepts a callable which is used to determine if it should be rendered. In our dashboard, that callable is registered in the boot method of AppServiceProvider.
OhDearUptimeTileComponent::showTile(fn (array $downSites) => count($downSites));
This is how that callable gets used in the OhDearUptimeTileComponent.
public function render()
{
    $downSites = OhDearUptimeStore::make()->downSites();

    $showTile = isset(static::$showTile)
        ? (static::$showTile)($downSites)
        : true;

    $refreshIntervalInSeconds = config('dashboard.tiles.oh_dear_uptime.refresh_interval_in_seconds') ?? 5;

    return view('dashboard-oh-dear-uptime-tile::tile', compact('downSites', 'showTile', 'refreshIntervalInSeconds'));
}

public static function showTile(callable $callable): void
{
    static::$showTile = $callable;
}
The contents of showTile will eventually be passed on the the $show prop of the x-dashboard-tile. In the Blade view of x-dashboard-tile it gets used to determine if the tile should be displayed or not with {{ $show ? '' : 'display:none' }}
Exploring themes
The dashboard has a dark mode. This is is how that looks like.
In the dashboard config file there are a couple of options available that determine if the dashboard should use light or dark mode.
return [
    /*
     * The dashboard supports these themes:
     *
     * - light: always use light mode
     * - dark: always use dark mode
     * - device: follow the OS preference for determining light or dark mode
     * - auto: use light mode when the sun is up, dark mode when the sun is down
     */
    'theme' => 'auto',

    /*
     * When the dashboard uses the `auto` theme, these coordinates will be used
     * to determine whether the sun is up or down
     */
    'auto_theme_location' => [
        'lat' => 51.260197, // coordinates of Antwerp, Belgium
        'lng' => 4.402771,
    ],
];
Our own dashboard used auto mode. This means that light mode is used when the sun is up, dark mode when the sun is down. To determine the position of the sun the spatie/sun package is used.
My colleague Sebastian added a nice option: you can force the dashboard in a specific mode by adding a URL parameter: ?theme=dark. This is handy if you want to display a dashboard on a second screen and always want it to be dark, no matter how the dashboard is configured.
Creating your own tile
If you have knowledge of Laravel, creating a new component is a straightforward process.
Creating a minimal tile
At the minimum a tile consist of a Livewire component class and a view. If you have never worked with Livewire before, we recommend to first read the documentation of Livewire, especially the part on making components. Are you a visual learner? Then you'll be happy to know there's also a free video course to get you started.
This is the most minimal Tile component you can create.
namespace App\Tiles;

use Livewire\Component;

class DummyComponent extends Component
{
    /** @var string */
    public $position;

    public function mount(string $position)
    {
        $this->position = $position;
    }

    public function render()
    {
        return view('tiles.dummy');
    }
}
You should always accept a position via the mount function. This position will used to position tiles on the dashboard.
Here's how that tiles.dummy view could look like
<x-dashboard-tile :position="$position">
    <h1>Dummy</h1>
</x-dashboard-tile>
In your view you should always use x-dashboard-tile and pass it the position your component accepted.
Fetching and storing data
The most common way to feed a component data is via a scheduled command. Inside that scheduled command you can perform any API request you want. You can also store fetched data and retrieve in your component however you want. To help you with this, the dashboard provides a Tile model that can be used to store and retrieve data.
Let's take a look at a simple example.
namespace App\Commands;

use Illuminate\Console\Command;
use Spatie\Dashboard\Models\Tile;

class FetchDataForDummyComponentCommand extends Command
{
    protected $signature = 'dashboard:fetch-data-for-dummy-component';

    protected $description = 'Fetch data for dummy component';

    public function handle()
    {
            $data = Http::get(<some-fancy-api-endpoint>)->json();

            // this will store your data in the database
            Tile::firstOrCreateForName('dummy')->putData('my_data', $data);
    }
}
This command could be scheduled to run at any frequency you want.
In your component class, you can fetch the stored data using the getData function on the Tile model:
// inside your component

public function render()
{
    return view('tiles.dummy', [
       'data' => Spatie\Dashboard\Models\Tile::firstOrCreateForName('dummy')->getData('my_data')
    ]);
}
In your view, you can do with the data whatever you want.
Refreshing the component
To refresh a tile, you should pass an amount of seconds to the refresh-interval prop of x-dashboard-tile. In this example the component will be refreshed every 60 seconds.
<x-dashboard-tile :position="$position" refresh-interval="60">
    <h1>Dummy</h1>

    {{-- display the $data --}}
</x-dashboard-tile>
If your component only needs to be refreshed partials, you can add wire:poll to your view (instead of using the refresh-interval prop.
<x-dashboard-tile :position="$position" >
    <h1>Dummy</h1>

     <div wire:poll.60s>
        Only this part will be refreshed
    </div>
</x-dashboard-tile>
Styling your component
The dashboard is styled using Tailwind. In your component you can use any of the classes Tailwind provides.
In addition to Tailwind, the dashboard defines these extra colors for you to use: default, invers, dimmed, accent, canvas, tile, warn, error.
By default, these colors are automatically shared by the textColor, borderColor, and backgroundColor utilities, so you can use utility classes like text-canvas, border-error, and bg-dimmed.
These colors have a separate value for light and dark mode, so your component will also look beautiful in dark mode.
Adding extra JavaScript / CSS
If your tile needs to load extra JavaScript or CSS, you can do so using Spatie\Dashboard\Facades\Dashboard facade.
Dashboard::script($urlToScript);
Dashboard::inlineScript($extraJavaScript);

Dashboard::stylesheet($urlToStyleSheet);
Dashboard::inlineStylesheet($extraCss);
Packaging up your component
If you have created a tile that could be beneficial to others, consider sharing your awesome tile with the community by packaging it up.
This repo contains a skeleton that can help you kick start your tile package.
When you have published you package, let me know by sending a mail to info@spatie.be, and we'll mention your tile in our docs.
Displaying the dashboard on a TV
Behind our tv there is a Raspberry Pi 2 that displays the dashboard. It is powered by a USB port in the tv and it has a small Wifi dongle to connect to the internet, so cables aren't necessary at all.
The Pi used the default Raspian OS. When it is powered on it'll automatically launch Chromium 56 and display the contents of https://dashboard.spatie.be.
Previous iterations
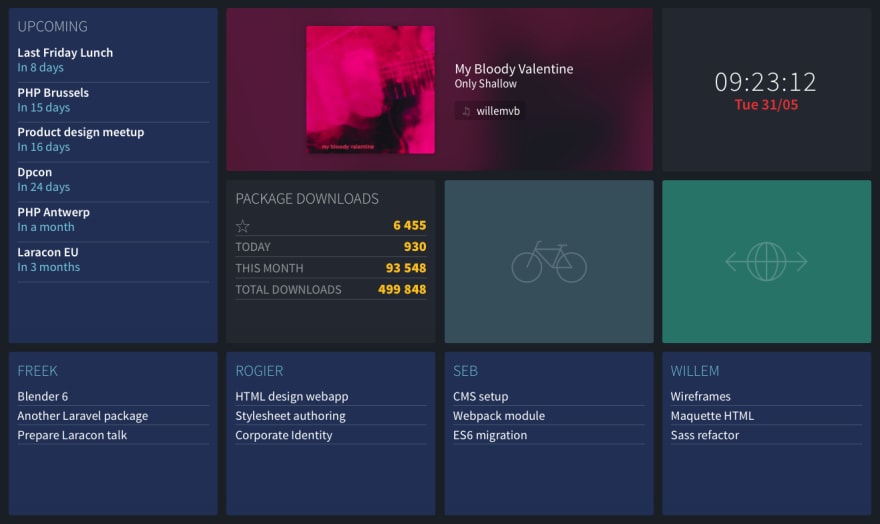
We created our dashboard a couple of years ago. Every year we iterate on it. Here are some screenshots from the very first version up until the most current one.
Comparing Vue/WebSockets to Livewire
Some people consider WebSockets to always be superior to polling. To me that is silly. I think, like a lot of things in programming, it depends on the context.
In the previous iterations of our dashboard we used WebSockets. This brought two nice benefits to the table:
- the dashboard got updated as soon as new data comes in
- in theory, keeping the dashboard open on multiple screens (even thousands) wouldn't result in any meaningful extra load. New event data was broadcasted out to all connected clients.
There were also some drawbacks:
- the tech stack is more complicated: you need to have a WebSocket server running at all times
- when opening the dashboard old data was potentially displayed. The dashboard would only be up to date after a few minutes, when all tiles got new data via newly broadcasted events. We could fix that by also storing and loading data from the db, but that would make the Vue components more complicated.
- because of the Vue components, there should be a build process to compile the tiles. This makes it, not impossible, but more difficult to package tiles up.
Switching to Livewire brings a new set of benefits and drawbacks. Let's start with the benefits:
- the tech stack is extremely simple. Because we use server rendered partials (powered by Livewire), you don't need to write any JavaScript yourself to achieve near real time updates.
- it's now very easy to package up and share tiles. Only knowledge of PHP is needed
- because the data is stored in the database and also loaded on the initial load of the dashboard, the displayed data is immediately up to date.
I see these drawbacks:
- because every browser triggers re-renders, the load on the server increases with every open instance of the dashboard
- the dashboard isn't 100% realtime anymore as even the Twitter tile only polls for new data every 5 seconds
- Livewire isn't an industry standard like WebSockets
Choosing between Vue/WebSockets and Livewire is a trade off. For our use case, I prefer the benefits/drawbacks that Livewire brings. The simplicity is appealing to me. Our dashboard is never going to opened more than in a couple of places. Even if every member of our team has the dashboard open, our server doesn't break a sweat.
One cool thing to note is that should you want to use Livewire in combination with WebSockets, you still have that option (scroll down to the Laravel Echo section).
If you would prefer a dashboard that is powered by Vue/WebSockets, you can fork the vue-websockets branch of the dashboard.spatie.be repo.
Closing off
The dashboard is a labour of love. I'm pretty happy that in our latest iteration we could make it much simpler, thanks to Livewire. One of the things that always bothered me was the tiles couldn't be easily packaged up. That problem has now been solved. I'm pretty curious what kind of tiles people will come up with.
If you create a custom tile package, do let me know. I'll add it to our docs. Should you create a dashboard of your own using our package, feel free to send me a screenshot.
In a next iteration of the dashboard, I'm thinking of adding an admin section where people can add tiles and customise the dashboard. That might be a good addition for next year!
Want to get started using the dashboard, head over to the documentation.
If you like the dashboard, please consider sponsoring us on GitHub.
If you're still here reading this, you probably are pretty excited about the dashboard. Here's the recording of a stream where I first showed off the Livewire powered dashboard.











Top comments (0)