Finding memory leaks in your Java application could be a needle in a haystack exercise if you are a rookie or intermediate Java developer who is yet to know their way around the Java Virtual Machine (JVM) production environment. However, depending on your profiling tool, you can easily analyze your Java memory consumption, while obtaining instantaneous insights into the heap in your Java production applications. But before we go into the details on how to find memory leaks in java web applications, let’s get into what a Java memory leak is, the possible causes of such leakages and remediation procedures to handle this.
Java Memory Leak
A memory leak is simply caused by reference chaining which is held up in the PermGen and cannot be garbage-collected. Sounds gibberish, right? Well, keep calm and follow-through while I explain further. Since web containers utilizes a class to class loader mapping system to isolate web applications and because a class is uniquely identified by its name and the class loader that loaded it. Hence, you can have a class with the same name, loaded multiple times in a single JVM – with each class having a distinct class loader.
Whereas;
An object retains a reference to the class (java.lang.Class) that instantiated it.
The class in turn retains a reference to the class loader that loaded it.
The class loader retains a reference to every class it loaded.
This potentially becomes a very big reference graph to handle on a long run. Not to forget that these classes are loaded directly into the PermGen. Therefore, retaining a reference to a particular object from a web application pins every class loaded by the web application in the PermGen. These references often remain even after a web application is reloaded and with each new reload, more classes get pinned or stuck up in the PermGen – which in due course gets full.
What is a PermGen?
PermGen, short for Permanent Generation is a heap in the JVM dedicated to storing the JVM’s internal representation of Java Classes – and also detained string instances. In simple terms; it is an exclusive heap location separate from the primary Java heap, where the JVM registers metadata related to the classes which have been loaded.
Although, most Java Servlet containers and WebSocket technologies enable the org.apache.catalina.core.JreMemoryLeakPreventionListener Class by extension such as Apache Tomcat 7.0 and upwards. Nonetheless, the inclusion of this memory leak handler wouldn’t suffice in the event of a more sophisticated such as PermGen errors on reload and bug interference caused by the application itself. This gets a little more interesting when the Tomcat servlet isn’t causing the leak, neither is the application (at least not directly) but rather a bug in the JRE code triggered by some third-party library.
With the advent of the Java Development Kit – JDK6 (Update 7 or later), comes a handy tool that ships with the JDK and makes life a whole lot easier for us. This tool is called the VisualVM; which is a graphical tool that seamlessly connects to any JVM and allows you to expel unwanted garbage from the JVM’s heap besides letting you navigate that heap. In a Tomcat servlet, a class loader for a web application is also a class called org.apache.catalina.loader.WebappClassLoader. Wherefore, if our Tomcat instance has just a single web application deployed, then there should only be one instance of this class in the heap. But in the event that there are more, then we have a leak.
STEPS ON HOW TO FIND MEMORY LEAKS IN JAVA WEB APPLICATIONS
Now that we have that out of the way, let’s quickly dive into the steps on how to detect and avoid Java memory leaks. Let’s immediately lucubrate on how we can use VisualVM to figure this out.
Steps:
- Open the command prompt terminal and type in the following command below to Start Visual VM;
${JAVA_HOME}/bin/jvisualvm
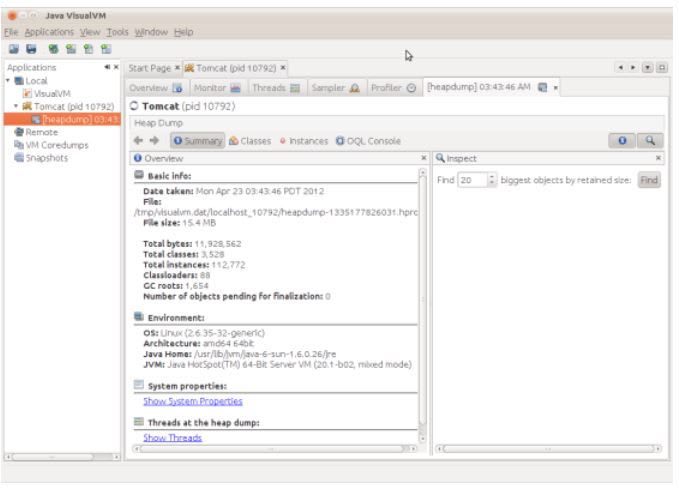
A window similar to figure 1 would pop up.
How to Find Memory Leaks in Java Web Applications
Figure 1: The Java VisualVM
- Right-click on Tomcat from the sidebar on the left-hand side then select ‘Heap Dump’.
How to Find Memory Leaks in Java Web Applications
Figure 2: Heap Dump: Click on the ‘OQL Console’ button.
- Click on the ‘OQL Console’ button at the top of the Heap Dump navbar. This opens up a console that allows you to query the heap dump. For this exercise, we want to locate all instance of org.apache.catalina.loader.WebappClassLoader.So enter the command below in the resulting console;
select x from org.apache.catalina.loader.WebappClassLoader x
Figure 3: ‘OQL Query Editor Console’: Type in the above command and click execute
- In this case, VisualVM found two instances of the web application class loader; one slated for the web application itself and the other for the Tomcat manager application.
Use the Tomcat manager application to restart the web application at http://localhost:8080/manager/html and take yet another heap dump of the Tomcat process.
Figure 4: Restart the web application and navigate back to the ‘OQL Console’ to repeat step 3 again
- Notice the inclusion of an extra instance from the above step. This is because one of these 3 instances was supposed to be collected by the garbage-collector, yet it wasn’t. Thanks to Tomcat we can easily tell which instance was not garbage-collected as all active class loaders are provisioned with the field name: ‘started’ set to ‘true’.
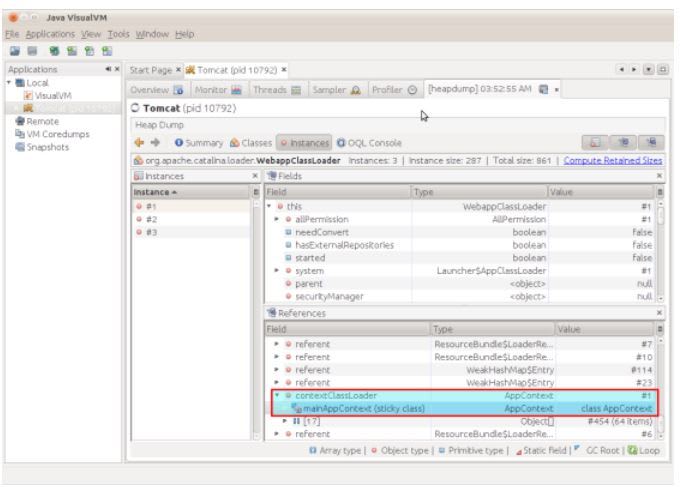
In order to find the invalid instance, click through each class loader instance until you find the one whose ‘started’ field is set to ‘false’.
Figure 5: Click through each class loader instance in the heap dump to spot the faulty one – with the ‘started’ field set to false
- Now that we have spotted the class loader that causes the leak, we need to determine what object is holding a reference to the class loader. Evidently, a good number of objects would be referenced by many other objects, but in all essence, only a limited number of these objects would form the root of the graph of references. These are particularly the object(s) we are interested in.
Therefore, on the bottom pane of the instances tab, right-click on the object instances that forms the root of the reference graph and select ‘Show nearest GC root’.
The resulting window should look like this;
Figure 6: Right-click on the object instances that forms the root of the reference graph and select ‘Show nearest GC root’.
- Right-click on the instance and select ‘Show Instance’.
Figure 7: Right-click on the instance and select ‘Show Instance’.
- From this, we can deduce that this is an instance of the sun.awt.AppContext type. We could also see that the contextClassLoader field in AppContext is holding a reference to the WebappClassLoader. Hence, this is the errant reference causing the memory leak. Now we figure out what instantiated the sun.awt.AppContext type, for starters.
Firstly, we restart the Tomcat in debug mode with the following code;
export JPDA_SUSPEND=y
${TOMCAT_HOME}/bin/catalina.sh jpda
Then, we move on to remotely debug the class loading sequence – in which case I would be using Eclipse to do this. Also, we need to set a class loader breakpoint on sun.awt.AppContext;
Use the Open Type Command (Shift+Control+T) to navigate to the sun.awt.AppContext type.
Right-click on the class name in the Outline pane and choose ‘Toggle Class Load Breakpoint’.
Thereafter, we need to trigger the class loading sequence by connecting the debugger to the Tomcat instance and having the debugger come to a halt exactly at the point where the sun.awt.AppContext is loaded;
Figure 8: Connecting the debugger to the Tomcat instance and set the debugger to stop right after where the sun.awt.AppContext is loaded.
And there you go! It has been instantiated by the JavaBeans framework, which in this instance is being used by the Oracle Universal Connection Pool (UCP). We could therefore notice that the contextClassLoader is a final field and it looks like AppContext appears to be a singleton; so we can assume that this field is set once and once only during the instantiation of AppContext.
so we can infer that this field is set once and once only during the instantiation of.
I conveniently added the above code to my servlet context listener, causing it to execute during application start-up and it had the desired effect of remedying this particular memory leak.
How to Find Memory Leaks in Java Web Applications – Summary
In summary, JEE Applications’ PermGen ‘out of memory errors’ usually reside in the application itself (or a library used by the application) and is often compounded by classes in the JRE library holding references to the web application class loader or objects instantiated by the web application class loader.
The overall process of finding the causative agent of a leak is to utilize a Java Application Performance Monitoring (APM) solution. Just like Fusion-Reactor’s heap analyzer to source for uncollected web application class loader instance(s) and subsequently source for the root GC object that is directly or indirectly holding onto the class loader. When you find this object, you can now use the APM’s inbuilt debugger to discover how this object is being instantiated and then devise a means to modify its conventional behavior. This is done so that it does not continue to hold on to the class loader reference forever.


Top comments (0)