Wireshark is an Open Source network protocol analyser. It sniffs the network and can decode the packets 100s of protocols. You can even write your own protocol dissectors for proprietary protocols and plug them in to the tool.
The Story
I was working on a project where our product was integrating 8 other systems. The project had a hard deadline - I mean properly hard, it aligned to the start of a large international event.
The integration tests would be overseen by government officials. With 8 other companies involved, I knew the deal. If something went wrong, all fingers would be pointed at us first because we were the integrators. Simply pointing to our log files would not be enough. So I wanted a 3rd party tool to prove which side of the network exchange was the problem.
Enter Wireshark: the perfect tool to save us from potential integration chaos. We had quite a few proprietary protocols in the mix too so I directed my team to implement Wireshark dissectors for these protocols. Management wasn't immediately overjoyed at developing software that would not be used directly in the final system but I made my case and they reluctantly agreed.
Well the integration tests were magical (for us). When things didn't work (and lots of things didn't work), we pointed the finger at the company that was at fault. When the company at fault tried to counter our arguments (trying to save face in front of the government officials), we showed them the output from Wireshark which was viewed as a relatively impartial tool. Our company looked strong and in control.
So yes Wireshark saved us from potentially disastrous integration tests. And yes we hit the deadline and became one of the only integrated systems to be delivered on time in the race to finish before the event.
The Tool
The user interface can be quite intimidating but once you overcome the learning curve, I think you will find this tool invaluable.

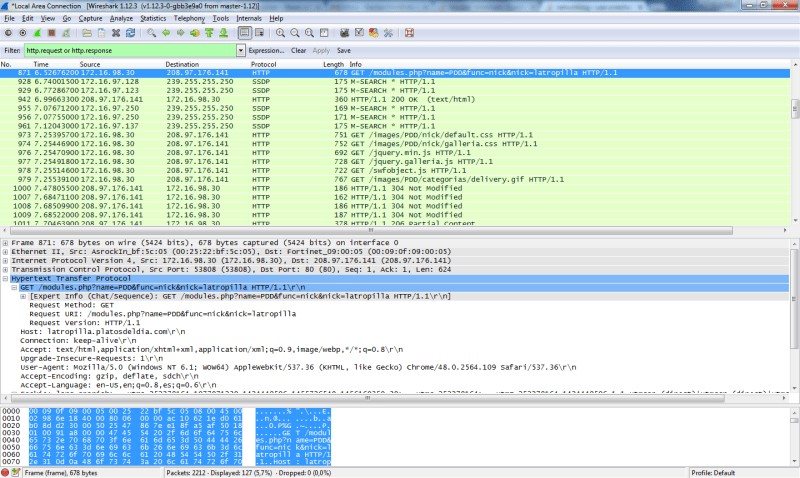
The image above shows the dissection of a sample of HTTP network traffic.
To understand the user interface, there are 2 main panels you need to wrap your head around: the exchange panel and the protocol stack panel. (Those are my terms and not the official terms but that is how I think of them.)
The Exchange Panel
The exchange panel shows the exchange of network packets between source and destination IP addresses.

The image above highlights the exchange panel. It shows the:
- packet number,
- the time (which can be shown in absolute time, relative from last packet time, or time since start of capture),
- the source IP address,
- the destination IP address,
- the protocol Wireshark has automatically determined the network exchange to belong to (which is configurable depending on the protocol),
- the length of the packet,
- a high-level summary of the exchange.
The Protocol Stack Panel
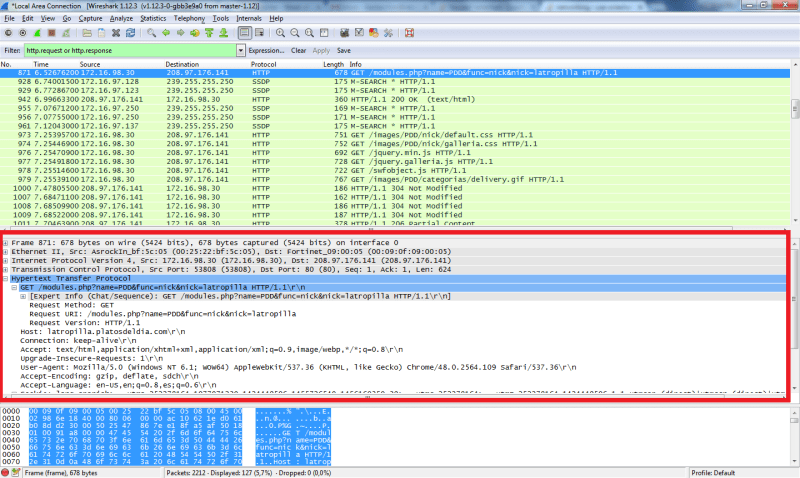
You can think of a network packet as an envelope with address information relevant to the protocol on it. Contained within it is some protocol specific data and another envelope also with another protocol specific address information on it and with protocol data inside it and another envelope. It's kind of like a Russian doll with envelopes nested until you get to the inner most envelope.

The image above shows the protocol/envelope stack. Selecting a packet in the exchange panel, shows the corresponding protocol stack for a single HTTP packet. In the case above we have:
- the Ethernet frame
- the Internet Protocol (IP) frame
- the Transmission Control Protocol (TCP) frame
- finally the HTTP frame
There are heaps of useful functions in Wireshark and this is just a simplistic overview. But I hope it has been of use to you now or in the future.


Top comments (0)