Users hate hourglasses, spinning wheels and other reminders that their precious time is wasting while apps and networks slowly grind away. Research is clear: waits of more than 2-5 seconds lead quickly to abandons and curses. Good developers understand the need to optimize mobile performance and user experience, both before and after production.
Fast apps and page loads are especially crucial in hyper-competitive industries like telecom. Janky, cranky mobile experiences aren’t exactly the best look for a leading-edge communications service provider (CSP) battling for new consumer and business subscribers.
So this fall, when a major multinational telco asked HeadSpin to run mobile performance testing in its key (and highly competitive) New Zealand and Australia markets, we jumped at the chance to help. We knew we could improve understanding of their network, application performance and user experience. We also wondered if reported billing troubles on their monolithic core system was also causing problems for people interacting with the company via its mobile app.
What we found is instructive in helping companies of all types spot and fix issues contributing to sluggish mobile experience. We’re sharing here as a part of our occasional posts showing how data-driven, pinpointed adjustments can yield big improvements in both customer experience as well as in technology and business performance.
ABOUT THE SESSION
HeadSpin conducted our tests on Monday, Oct. 21. As always, the goal was to help identify the root cause of high-priority performance issues, from the client-side all the way to server-side.
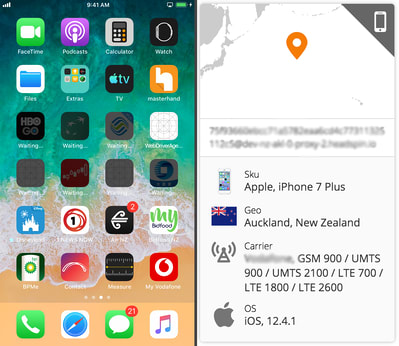
Our team generated a performance session, which was then analyzed by our AI-based issue-detection engine. We used an iOS 12.4.1 device located in Auckland, New Zealand on the company’s mobile network (Tests can be run on 32,000+ different devices across 160+ locations in 110+ countries). The scenario: A mobile customer is looking to check his balances, increase his data plan, and sign up for roaming for an upcoming trip to Japan.
We’ll do a quick walk through the results below. offers high-level session-wide metrics, domain metrics, burst metrics and host metrics.
Here's a snapshot of the testing setup:
A final note: We didn’t do (and never do) any rooting or jailbreaking to run the test. Both give you elevated system privileges on a device, and that’s something an ordinary user would never get or do. So no jailbreak for you.
THE EXPERIENCE
A hint that the app test might not break speed records comes early in the session. There’s an obvious lag in the form at :26 seconds, when our test customer enters a password. That’s followed by another noticeable experienced delay, when it takes a few seconds to log in. In the meantime, we’re left watching an animated white “working on it ” icon wiggle on a brightly`` colored background. It’s cute, but quickly irksome. As feared, the biggest delay of the session comes at 1:48, when our user tries to update his roaming services.
In the end, overall wait times for our app end-user exceeded 6.5 seconds. (For perspective, that’s enough time for a light beam to travel 1,210,833 miles, the equivalent of 48.75 trips around the equator). What on Earth was going on?
Here’s what all the tests looked like in context. Obviously, there are too many data and performance insights to fully explore here. So let’s focus on three key areas:
ISSUE 1 SLOW SERVERS
Server performance is a key foundation of mobile app performance. The most elegantly crafted app can be slowed by sluggish back-end performance. Research shows a straight line between wait times and user abandonment. Google/SOASTA found probability of bounce jumps to 123% with a 1-10 second delay in mobile page loads. Akamai calculatesthat a 2x increase in mobile load time cuts conversions by 50%. Too slow and users go.
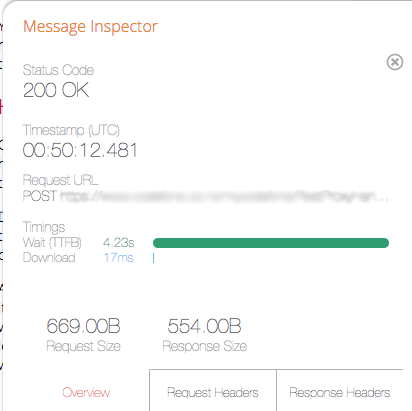
That’s why it was concerning that our test run uncovered serious slow server issues. Delays in this foundational function were, unfortunately, a big contributor to overall delays experienced by our test app user. For instance, the app waited 4.23 seconds for the http POST request and 2.11 seconds for a GET request. Not good on either count.
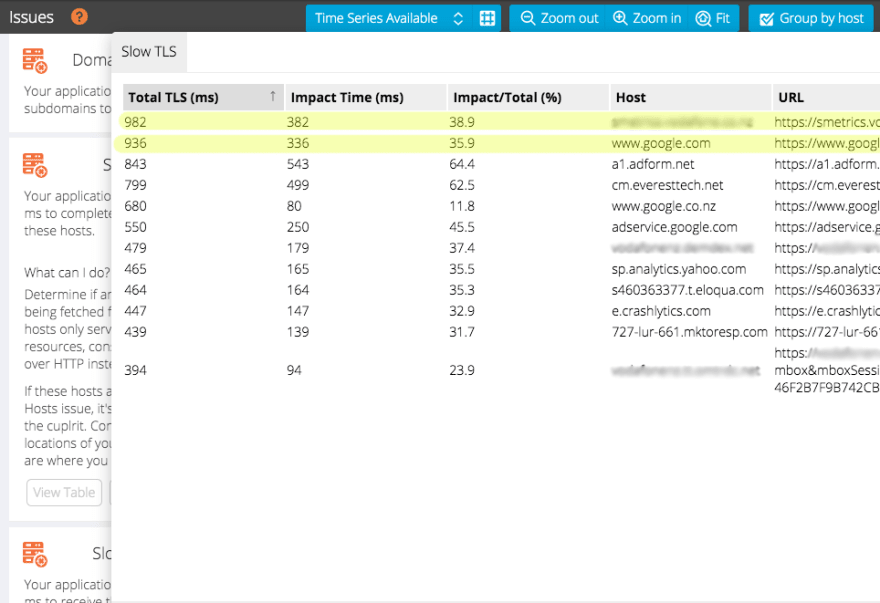
As a rule, any wait time longer than 300ms to complete a handshake with the host is worth investigating. In one case, the app waited for as long as 394 ms. We confirmed the physical location of the laggard destination as Sydney, Australia. But it got worse: In another instance, we timed the wait at 982 ms. That server was in located in Utah. The southwest United States is a long way from New Zealand (more than 7,000 miles/11,300 km.), so that’s a likely culprit.
Remember that slow load we mentioned a minute ago? Here’s what it looks like to the user and the HeadSpin test system:
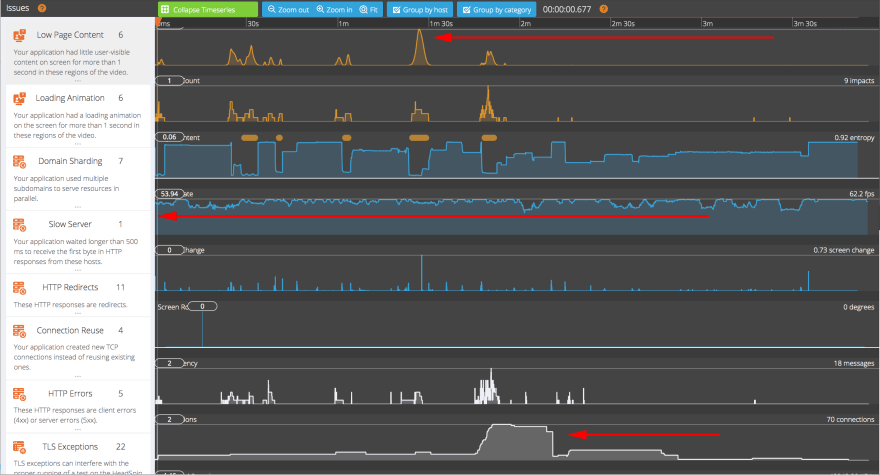
See the peak, two-thirds to the right? That’s your sloooow wait for the billing system described above.
This alternate view shows the slow server problem’s relative seriousness compared to other, cooler-colored issues.
To get a more granular idea of what’s impacting performance, take a look at this drill-down of analytics and ad services on the site. Impacts range from a relatively small 80ms. for Google to 543 ms. for a1/adform.net.
The Fix
Speeding up slow servers starts with a clear understanding of the resources that hosts are serving to your app. Are you expecting these hosts to be slow? You’ll want to determine if they’re performing a lot of server-side work before sending replies. If the hosts are part of a content delivery network, make sure they’re not serving resources from the wrong edge. And confirm that the physical location of the request's destination IP is where you think it is.
ISSUE 2 LOW PAGE CONTENT
Perhaps the only thing worse than a web page with no content is a page with low content. Issues here are closely related to the sever slowness described above. It’s why for more than a decade, Facebook has institutionalized best practices designed to do just that.
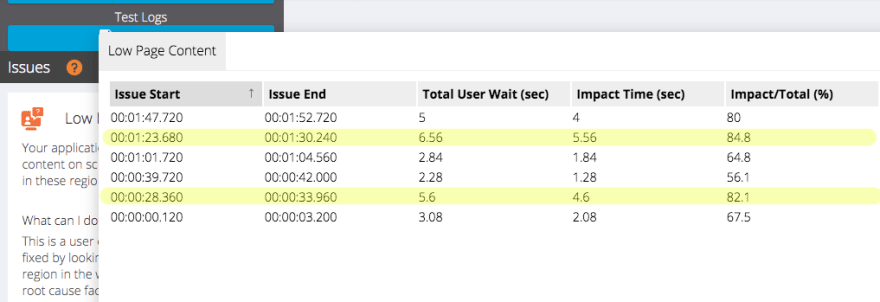
During our testing we found the end-user consistently experiencing little content on screen for more than one second at a time.
The associated delays contributed to a total of more than 5.5 seconds of wait time. With long network requests and network saturation as possible contributing factors, wait times reached 6.56 seconds in one instance as shown below:
The fix
Looking at the orange impact region in the Waterfall view lets HeadSpin correlate root cause factors, such as long network requests, network saturation, or usage in the system timeseries. Any abnormal metric in this region can be causing the issue.
In this case, it would be helpful to examine the keep-alive timeout. Proper setting ensures connections are re-used (as opposed to re-created) to avoid producing a sub-optimal user experience. So we did…
And indeed, testing found the app creating new TCP connections to the impacted host [www.the telco .co.nz:443], Since keep-alive connections is enabled, it’s wise to check that the timeout is not set too low, which could cause client connections to terminate prematurely, resulting in unnecessary TCP/TLS handshakes. Resetting the server ensures the TCP connection is not dropped.
ISSUE 3: SLOW ANIMATION LOAD
Animation on a mobile app can be tricky. Done well, it’s a delightful distraction during loads, judiciously recommended by UX gurus like Nielsen/Norman Group and Luke Wroblewski.
In our test, one of the (potentially) coolest parts of the test session (a customer increasing monthly data allocation) ended up, well, not so cool. Onscreen, the user was served with two spinning slot machine windows. “Grab the Prepay Deal of the Day!” The windows were supposed to stop, presumably revealing a great offer. Unfortunately, animation load and confirm time was slow (1.36 seconds on screen– long enough for a visitor to wonder if their luck had run out.
The fix
Problems with graphics loading often mean the app is waiting for a network resource. Looking around the Waterfall’s orange region reveals potential problems such as unusual, too much, or missing network traffic. One fix is to have app and server can improve the way the resource is loaded. Another way to speed up animation would be to rework the user design. Elements that load faster can be moved to the top, and slower elements relocated below the fold.
BOTTOM LINE
Slow loads are fast roads to losing customers. The advent of 5G will only further shrink the time that users will wait for both new and existing applications to load and run.
For the first time in 2019, consumers will spend more time on mobile phones than watching TV.
The average adult will spend 3 hours and 43 minutes a day on mobile devices, according to new research by eMarketer. Of that, 2:57 is spent on apps, the company says. Don’t miss out.
Performance testing offers a great, effective way to find and fix problem areas in production apps. The logic is simple: To fix performance, you need to measure performance. To measure performance, you need to see performance.
With our Digital Experience Platform, this telco gained valuable insights into their performance issues and steps to improve the end user’s experience in a highly competitive market and region. (An interesting postscript: A few days after our first test, came under criticism in the U.K for reported errors in roaming billing and unwanted customer disconnections.)
HeadSpin offers an enterprise-grade approach for global mobile experience. Our all-in-one platform for remote testing (with real SIM cards across 160+ locations), network testing, a complementary “mobile performance management”, and AI-driven approach simplifies pre-and-post launch improvements in real-world user environments.
Want to launch to launch flawless products faster? Identify and fix bottlenecks? Schedule a demo to learn more about how HeadSpin can help improve your customer's digital experience.





Top comments (0)