July is marketing & optimization month. Every day this month Verso will introduce a new tool for marketing or web optimization. To kick things off I’m starting with the most valuable of them all: The ultimate benchmarking tool for site speed optimization.
You simply enter your URL into the bar and then wait. (Because it’s free, you are sharing the resources with everyone else. Sometimes it can take up to a minute or two to profile your site. The number of other people using the tool at the same time will determine how long it will take — like waiting in a queue while on hold on the phone.)
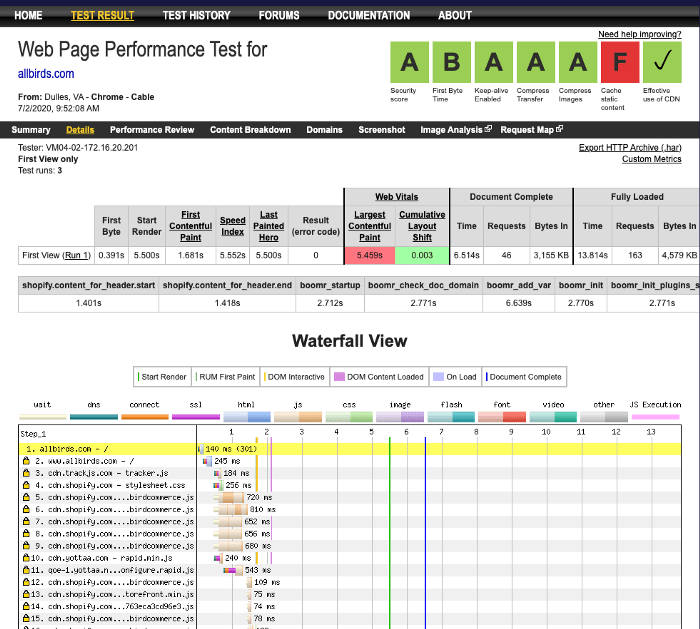
The first thing you’re going to see is a screen like this:
WebPageTest.org — This is one of the secret tools for web page optimizers (like me!) who make your website really fast. This will break down your page’s load time (into a “waterfall” chart) showing you which external endpoints are taking the longest, which ones are blocking the page, and how to speed up your site.
An excellent remote benchmarking tool with breakdowns of each of your external web requests, showing times for DNS, SSL Negotiation, TTFB (Time-To-First-Byte), Content Download. It includes critical five page-wide metrics that you need to pay attention to:
• First Byte
• DOM Interactive
• First Paint
• the all-important DOM Content Loaded (also known as $(document).ready in jQuery*)
• the also-important Content Download time (also known as $(window).load in jQuery*)
You’ll often want to run it a few times (in fact by default it runs twice anyway).
[*Note that jQuery is not required to be running on these websites. These are the corresponding jQuery hooks for the page rendering lifecycle associated with these events.]
This view shows you an aggregate summary. It actually runs the test three times, but usually, you get close results. In the area where you see the Network chart next to “First View,” click once.
Now you’ll come to the detailed view for the measurements.
This screen is where the magic happens. There’s a lot of information on this page, and I could teach a whole course on this subject. The two most important measurements to learn about first are First content paint (look for a light green line, not the dark green line) and the Document Complete (look for a blue line). Both are expressed as a number (and fraction) of seconds.
The First content paint is when the user will first see content, and the Document Complete is when they can interact with the page.
The First Byte time is largely dependent on your server architecture and your app and is beyond the scope of this article. If you have long First Byte times try New Relic as a performance tool to find the bottlenecks in your app and figure out how to eliminate them.
For the most part, DOM Interactive and First paint you don’t have control over, assuming your assets are correctly cached and delivered via a CDN.
The DOM Content Loaded is what we believe to be the most significant factor in the GPSI score, but keep in mind that Google will punish you if above-the-fold content is not loaded by the DOM content loaded point, or shortly thereafter. Consider there are many seconds between the 4th and 5th measurements, your images and some Javascripts are downloading. What you want to do is prioritize the above-the-fold images first, so they appear for the user as quickly as possible.
If you do this, Google will favor you. If you don’t do this and your Content Download times ($(window).load) extend out several seconds, your Google score will drop.
Next, you’ll need to understand how to load your Javascript, internal & external, using async and defer. Unfortunately, that’s beyond the scope of this post today.
Webpagetest is the gold standard for a reason: It gives you nice scores for: First Byte Time, Keep-alive Enabled, Compressed transfers, Compressed images, cached static content, and using a CDN.
Caveats: I’ve noticed that WPT tends to list many ad pixels — which inherently cannot be cached– in the “Leverage browser caching of static assets” section and thus may give a lower score here if you have too many ad pixels. I’m not exactly sure why WPT isn’t smart enough to know that these are ad pixels, maybe it would be better if the ad industry moved over to AJAX requests via JSON endpoints instead (cough, cough, antiquated technology, cough, cough). Perhaps if more did then a tool like this wouldn’t see ‘pixels’ (non-visible image files that serve only to communicate with foreign servers but aren’t actually images the user sees) as cacheable resources.
Although this optimization tool is a little complex for non-technical users, laymen marketers and site builders can easily run their site through WPT to get a sense of how fast their site is performing. Remember, it can publicly profile any website so you can run tests on your competitors’ websites too.
If you need help with this my consulting agency VERSO COMMERCE can help you with site speed, analytics, competitive research, Wix, Shopify, React, or NextJS/Node apps. Get in touch today at https://versocommerce.com


Top comments (0)