Introduction
There are many reasons why reacting to time series data is useful, and usually, the quicker you can respond to changes in this data, the better. The best tool for this job is easily a time series database, a type of database designed to write and read large amounts of measurements that change over time.
In this tutorial, you will learn how to read data from a REST API and stream it to QuestDB, an open-source time-series database. We will use Grafana to visualize the data and alerting to notify Slack on changes that interest us. We use Python to fetch data from the API and stream it to QuestDB and you can easily customize the scripts to check different stocks or even APIs.
Configuration
Prerequisites
Before getting started with the tutorial, you will need the following things:
Docker desktop - we have created a GitHub repository that will enable you to run Grafana and QuestDB in a Docker container. The project README also documents setup steps for Grafana, QuestDB, and Python.
IexFinance Account - we will use the IexFinance API for polling stock prices, note that a free account on IexFinance has a limit of 50,000 API calls per month.
Slack workspace - to deliver alerts about Stock prices from Grafana, you'd need a Slack workspace with the ability to create incoming webhooks.
Deploy QuestDB & Grafana containers using Docker
Firstly clone the repository from GitHub :
git clone git@github.com:questdb/questdb-slack-grafana-alerts.git
Running docker-compose up will bring up two containers that are networked together; Grafana is running on localhost:3000 and QuestDB has a web console available on localhost:9000 as well as a port open on 8812, which can accept Postgres protocol.
To check if your QuestDB and Grafana containers are working, please visit the aforementioned URLs. Alternatively, you can check the status using docker-compose ps on the command line, which should show you the following output:
Running docker-compose will also provide Grafana with the default connection credentials to use the Postgres authentication. This means you can use QuestDB as a default data source in Grafana right away without manual configuration steps.
Install Python Libraries
All the Python libraries required for this tutorial are listed in the requirements.txt file. Install the requirements using pip:
pip install -r requirements.txt
Ingest mock data into QuestDB
We need some data in QuestDB to create some visualizations and alerts. We can use the IexFinance API to fetch stock prices and an additional script to generate dummy data. The IexFinance API has a cap of 50,000 requests per month in the free account, so our mock script can generate random prices so that we don't max out our trial during testing. To start ingesting mock data into QuestDB, run the script:
cd python
python mock_stock_data_example.py
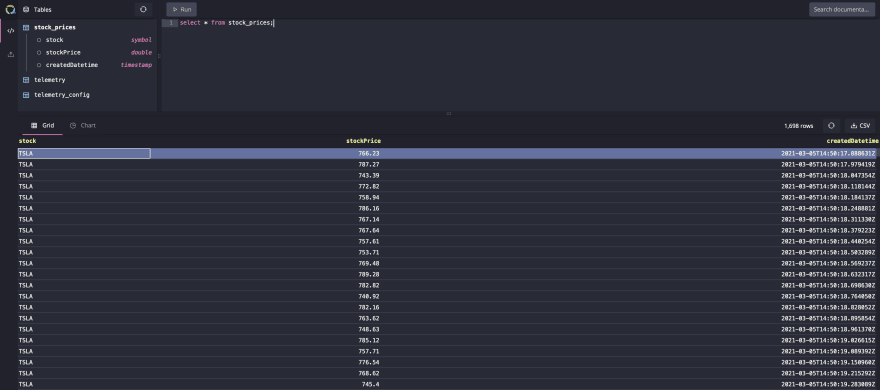
The script will automatically create a table stock_prices, and it will start ingesting mock data into this table that contains three columns:
- stock-listed name of the stock, e.g., TSLA for Tesla. QuestDB has an optimized data type, symbol , for text columns that have repetitive values. Read more about that in QuestDB's official documentation.
- stockPrice - price of the stock in USD in double.
- createdDateTime- timestamp at which stockPrice was ingested in QuestDB.
In the following screenshot, you can see that the data ingested in QuestDB:
Configure the IexFinance API
Once you have tested the ingestion, you can start using the API with real data. Using this API, you can query stock prices in real-time. As mentioned earlier, there is a cap of 50000 free API calls per month, so make sure you don't cross that limit while on the free plan. To configure IexFinance API, follow these steps:
- Create a free account on IexFinance.
- Create an API token.
- Press
Reveal Secret Tokenand copy theSECRETtoken. - Create a new file .env in the ./python folder.
- Paste the token in the .env file in the format →
IEX_TOKEN=Skwf93hD.
Configure a Slack Incoming Webhook
Next, we need to create a Slack webhook for sending alert messages from Grafana:
- Go to https://api.slack.com/apps?new_app=1
- Name your Slack app QuestDB Stock Price Alerts
- In Features and functionality choose incoming webhooks
- Activate incoming webhooks and click
Add New Webhookto Workspace - Select the channel to allow the app to post to and click
Allow - Copy the Webhook URL which is in the following format →
https://hooks.slack.com/services/T123/B0123/2Fb...
Create a Notification channel in Grafana
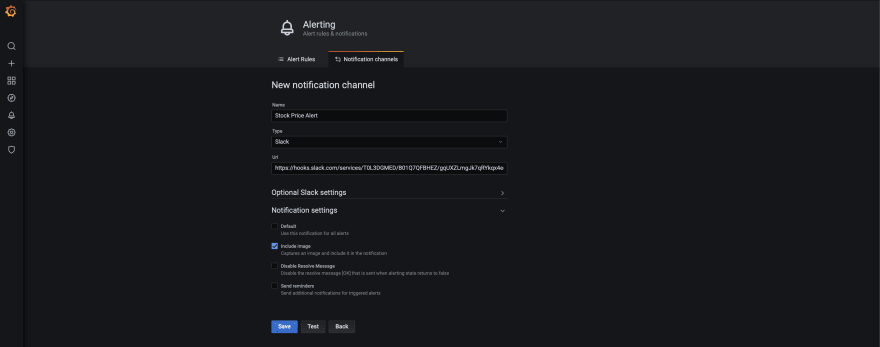
Go to localhost:3000 in your browser. To enable connectivity between Grafana and Slack for alerting, click Add Channel in the Alerting > Notification channels section as shown below:
Paste the Slack Incoming Webhook URL in the Url field while creating a new notification channel as shown below:
You can quickly test if the webhook is working fine by pressing the Test button on the screen above. This will trigger a notification from Grafana to be published on Slack. You can see an example notification below:
Create a Grafana Panel & Setup the Alert
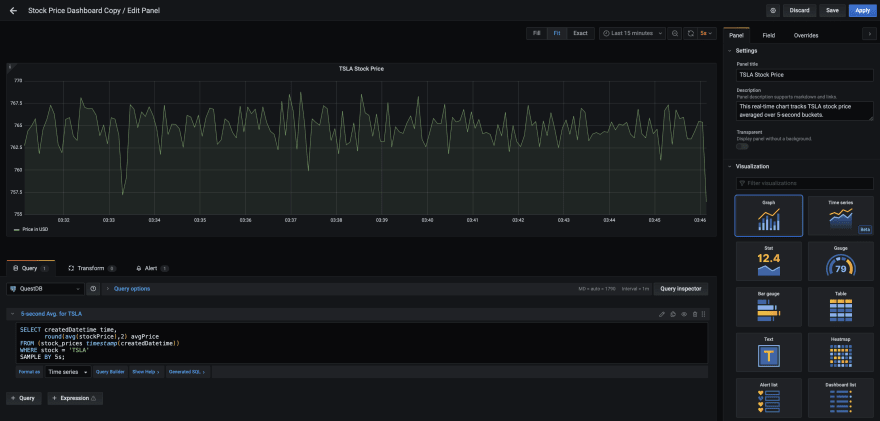
Set up a Grafana panel that hosts the real-time graph of TSLA stock price using the following steps:
- Navigate to +
Create and select Dashboard - Click +
Add new panel - In the panel, click the pencil icon or click
Edit SQLand paste the following example query:
SELECT createdDatetime time,
       round(avg(stockPrice),2) avgPrice
FROM (stock_prices timestamp(createdDatetime))
WHERE stock = 'TSLA'
SAMPLE BY 5s;
After creating the Grafana panel with the query shown in the image above. Save the dashboard. To create an alert on TSLA stock price, perform the following steps:
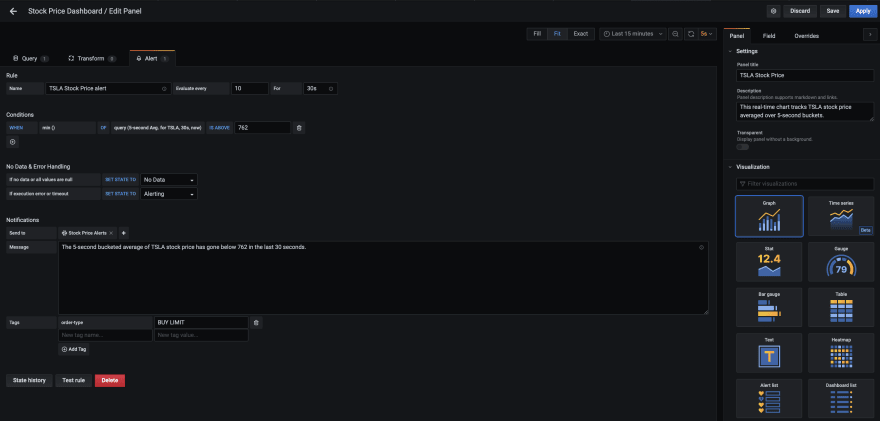
- Edit the panel in the dashboard.
- Go to the
Alerttab and name the alert Tesla Stock Price alert. - Set Evaluate every 10 seconds for 30 seconds (Evaluate every signifies how often the scheduler will evaluate the alert rule and for specifies how long the query needs to violate the thresholds before triggering alert notifications).
- Set the conditions to WHEN min() OF query(5-second Avg. of TSLA, 30s, now() IS BELOW 762. In other words, the conditions for alerting are met if the minimum value of the query named 5-second Avg. of TSLA is below 762 in the last 30 seconds.
- In the No Data & Error Handling section, use the defaults.
- In
Notifications → Sendto, select thenotification channelthat we set up earlier named Stock Price Alerts. - Add the message The 5-second bucketed average of TSLA stock price has gone below 762 in the last 30 seconds.
- Save the Panel.
You can see the steps in action below:
Once the condition is met, Grafana will trigger an alert and send a notification to Slack. The notification will be something like the screenshot below:
To understand the alert status changes more deeply, you can visit the State history. It will show you the timeline of transition from one status to another. You can see an example of state history below:
To learn more about building dashboards for time series data with Grafana, there's another tutorial on QuestDB's website with a link to example data to try out more features in detail.
Conclusion
In this tutorial, you learned how Grafana could confluence with QuestDB using the PostgreSQL endpoint. Using the data ingested from an API into QuestDB, you learned how to visualize that data in a Grafana dashboard and set up alerts based on some predefined conditions. You also learned how to publish alert messages to external tools like Slack. For more information on any of the topics covered in this tutorial, please visit QuestDB's official documentation.


Top comments (0)