The other day I started coding a Chrome extension that makes heavy use of Chrome's IndexedDB. Until this time then I had no problem inpecting any local storage using the DevTool's "Application" tab. Those were extensions that used Manifest v2 but as of June 2023 Google will only acept Manifest v3 extensions.
One of the main changes is that background pages are replaced with service workers. So I changed my code accordingly from:
"background": {
    "page": "background/background.html"
  },
to
"background": {
    "service_worker": "background.js",
  }
and coded happily on. When I reached the local storage part and wanted to check the local storage by clicking on the new "service worker" link:
Surprisingly the IndexedDB pane in the "Application" tab was empty though I definitely knew that there was data stored:
o what was happening? After a long search on the Internets I came across an answer on StackOverflow that saved my day.
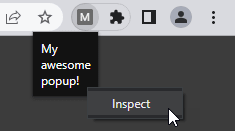
If your extension contains a popup you can right click and select "Inspect" to open the correct DevTools window:
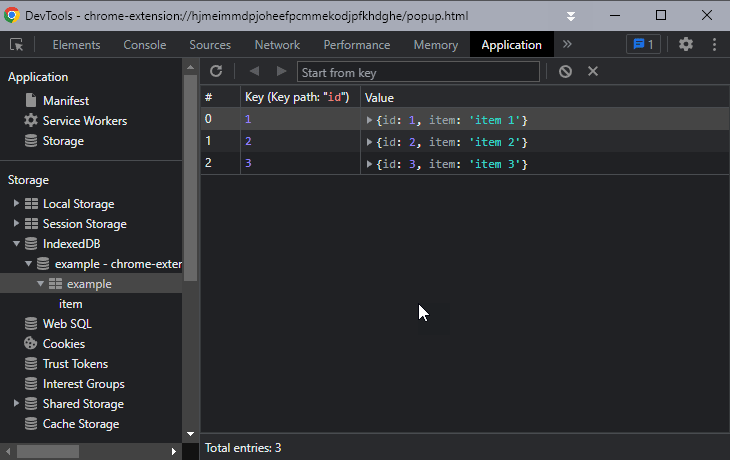
And there you go:
But what do you do if your extension does not containa popup? There is a solution though it's a bit more complicated.
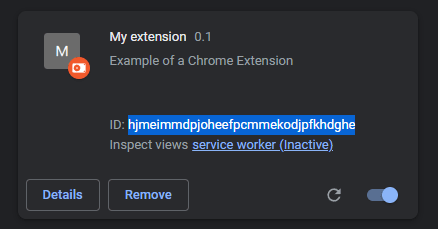
Open the extension page and look for the extension's ID:
Copy that ID and enter the following URL into the address bar, replacing "ID" with the actual ID:
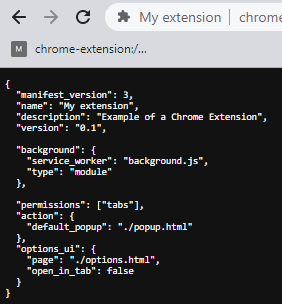
chrome-extension://ID/manifest.json
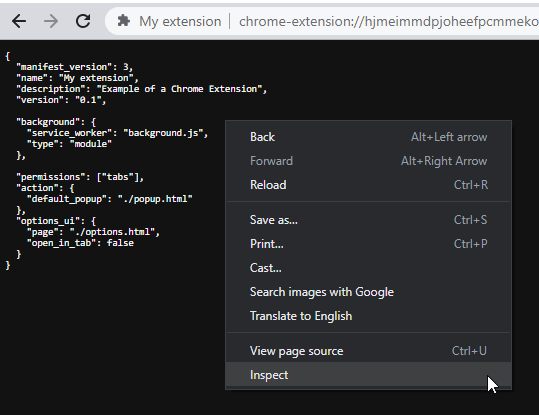
Right click on the window and select "Inspect":
One last problem: In contrast to the "classical" DevTools popup this one disappears if you reload the extension. Fortunately you can bookmark the tab:
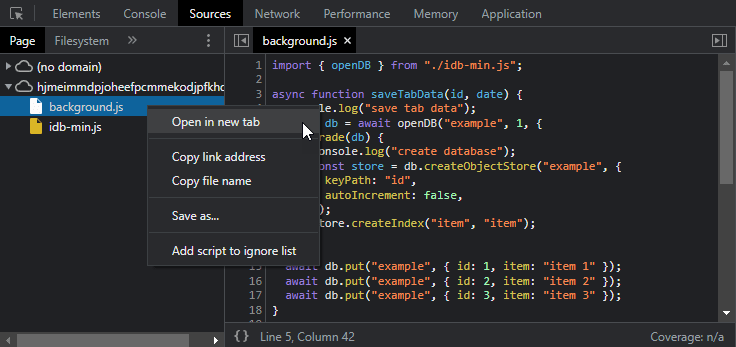
Update: You don't actullay need to insert the ID manually but you can click on any script in your default Devtools window (opened with "Inspect views service worker" link), right click on any script in the "Sources" pane, select "Open in new tab" and, just like above, right click the tab and select "Inspect":
The only question that remains is: Why, Google, why has this be so complicated?




Top comments (0)