Earlier this year, at my company, we hit a wall while developing a web application for a client. We had very limited finances and needed someone to support the DevOps side of things. Luckily, I had tools that later came in handy for me and made things a lot easier to handle.
Platform engineers develop the architecture that connects software and hardware. They are an essential component of the software and hardware businesses because they conduct diagnostic checks to ensure that the correct hardware design is used, which generally entails creating code for running diagnostics so that the hardware testing is automated. Furthermore, they manage all software service configurations in various environments and oversee application packaging procedures to ensure that each program is of the highest quality.
As a platform engineer of any level, there are some tools needed to deliver quality performance at your work. This article will highlight what some of these tools are and how they are useful to you as a platform engineer. Included tools have been evaluated based on the following criteria:
- Performance: these tools should support the platform engineer in providing quality development of software. Rather than slow down the user, these tools should help the user deliver excellent work in record time.
- Good documentation: the tools should possess sufficient and quality documentation or resources to help the user learn how to use the platform and get to working as soon as possible.
- Security: the tools should handle and manage information as discreetly as possible. Any information that a platform engineer is not authorized to give away should be protected at all costs.
- Scalability: the tools should scale on a growing team and not be discarded as soon as the team grows very large. Rather, they should enable the team to manage information access for members of different authorization levels on the team.
Now that you understand some of the more important factors to consider, take a look at some of the best tools to use as a platform engineer.
Terraform
Terraform is a platform for managing public cloud resources, such as AWS, GCP, and Azure, by creating infrastructure as code. Other cloud infrastructures, such as Stripe and Auth0, are also commonly managed with Terraform. Terraform is primarily used for three purposes: public cloud provisioning, multicloud deployments, and infrastructure as code (IaC) implementation.
Terraform facilitates the use of public clouds via a provider for public cloud provisioning. A Terraform provider may be thought of as a plug-in that wraps an existing company’s APIs to create declarative Terraform syntax. All providers that cover the major public clouds are open source and under the strict supervision of HashiCorp (the company behind Terraform). As a result, the providers receive regular updates to keep up with the cloud providers’ improvements.
For multicloud deployments, Terraform is cloud-friendly, in contrast to many infrastructure orchestration technologies that are cloud vendor–specific. For fault tolerance or disaster recovery, you may wish to distribute your application across different platforms. You may deploy your application on resources from various cloud providers by utilizing a single configuration file.
Terraform allows you to specify resources and infrastructure in human-readable, declarative configuration files and controls the life span of your infrastructure. Terraform tracks your entire infrastructure in a state file, which serves as the environment’s source of truth. Terraform uses the state file to decide which modifications to apply to your infrastructure to match your setup.
Below is a screenshot of Terraform initialization:
If you’d like to learn more about Terraform, visit this page to download a suitable package for your OS and get started.
GitLab
GitLab is a repository-hosting site that assists engineering teams in removing toolchain complexity and speeding up DevOps adoption. It enables the team to create an application that allows them to manage all efforts with a single user interface and simplifies administration by using a single centralized instance for all repositories. More specifically, GitLab is a web-based Git repository that offers free, open, and private repositories; issue tracking; and wikis. It is a full-fledged DevOps platform that enables professionals to handle all aspects of a project—from project planning and source code management to monitoring and security. It allows teams to collaborate to create better software.
GitLab assists teams in shortening product life cycles and increasing productivity, which produces value for customers. Users are not required to handle authorizations for every external application or tool utilized in the program. If you establish permissions once, everyone in the organization gets access to all the existing resources.
According to GitLab’s customer profile, Drupal and Goldman Sachs are heavy users of GitLab, which shows its usefulness in the industry.
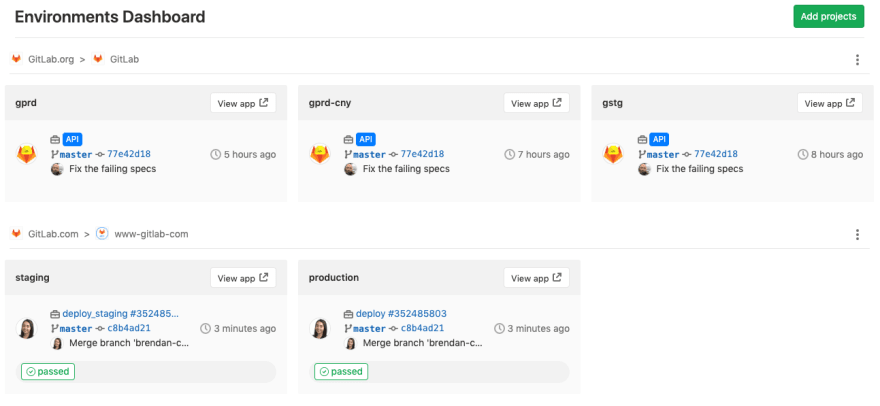
Below is a screenshot of a GitLab environment dashboard where users can see their projects and get a detailed view of how well each is performing:
To learn more about GitLab, view their docs.
cAdvisor
cAdvisor, an observability tool, has made monitoring containers easy. It gives users insight into the resource consumption and performance aspects of their running containers. cAdvisor is an open-source running daemon that aggregates processes and exports information about containers that are running. It saves resource isolation settings, historical resource consumption, histograms of total historical resource usage, and network data for each container. This information is exported by container as well as machine-wide.
Running cAdvisor on your machine is relatively straightforward. cAdvisor itself is a single container and can be started and ran using the docker run command. While cAdvisor is running, it will gather all other container images’ usage metrics and display them on its local web interface at <http://localhost:8080/>.
Below is a screenshot of the web interface displaying real-time usage metrics from other running containers.
If you’d like to learn more about cAdvisor, visit this page.
Kubernetes Dashboard
Kubernetes Dashboard is a web-based Kubernetes monitoring tool for smaller clusters. It gives you a graphical interface for controlling Kubernetes. Some of its functionalities are discovery, load balancing, and monitoring.
It displays valuable information about the Kubernetes cluster, such as the nodes in the cluster, namespaces, volumes, cluster roles, and job details. You can deploy a containerized application and control all cluster resources from the Kubernetes Dashboard with just a few clicks.
For troubleshooting, the dashboard displays aggregate CPU and memory consumption. It can also keep track of the health of workloads.
To deploy a Kubernetes Dashboard, you need to have a running Kubernetes cluster. Visit this tutorial to learn how to set one up. After setting up the Kubernetes cluster, run the command below to deploy your Kubernetes Dashboard:
kubectl apply -f https://raw.githubusercontent.com/kubernetes/dashboard/v2.0.0-beta8/aio/deploy/recommended.yaml
Below is a screenshot of the Kubernetes Dashboard’s local web interface:
If you’d like to learn more about Kubernetes Dashboard, visit this page.
Falco
Falco is a security-focused Kubernetes utility that identifies suspicious behavior in your containers. It inspects containers with a particular emphasis on kernel system calls. It also employs a solitary set of rules, which are needed to keep track of the container, application, host, and network.
It is compatible with both Kubernetes and containers. Each of your Kubernetes clusters can have its own set of rules. These rules can be applied to all containers. Falco natively supports container runtimes, which means it works perfectly with any container software you are using.
It builds the rules with tcpdump-like syntax and uses libraries, like libscap and libsinsp, which can extract data from your container using the Sysdig kernel module to intercept system calls.
After extracting data from the container, it uses the data to learn about pods, labels, and namespaces to develop rules tailored to a given namespace or container image. The regulations concentrate on system calls and which of them are permitted or prohibited on the system.
Falco checks for a variety of unusual behaviors in your application’s containers, including the following:
- Privilege escalation using privileged containers
- Namespace changes using tools like
setns - Read/writes to well-known directories, such as
/etc,/usr/bin, and/usr/sbin - Creation of symlinks
- Ownership and mode changes
- Unexpected network connections or socket mutations
- Spawned processes using
execve - Execution of shell binaries, such as
sh,bash,csh, and `zsh - Execution of SSH binaries, such as
ssh,scp, andsftp - Mutation of Linux
coreutilsexecutables - Mutation of login binaries
- Mutation of
shadowutilorpasswdexecutables, such asshadowconfig,pwck,chpasswd,getpasswd,change, anduseradd
Below is a screenshot of the Falco tool being used to detect an attack:
To learn more about Falco, visit this page.
CircleCI
CircleCI is a solution for continuous integration and continuous deployment (CI/CD) that automates software development, testing, and deployment. It works hand in hand with Git to track changes in the Git repo and comprises a simple YAML file in which you can provide instructions for what to do whenever a change to the Git repo is detected.
CircleCI also supports parallelism, allowing you to split your test across different containers to run as clean and separate builds. You can also secure your builds by managing your secrets as environment variables with it.
Here are some reasons why CircleCI is the preferred tool for continuous integration:
- It is optimized for faster build
- It is GitHub friendly and has an extensive API for custom integrations
- You can configure it to run very complex pipelines
- You can configure it to use sophisticated caching
- You can configure it to use docker layer caching
- You can configure it to use resource classes for running on faster machines
Below is a screenshot of GitHub repos on the CircleCI dashboard.
You can learn more by visiting their official documentation.
Vault
Vault by HashiCorp is a tool for managing software application secrets. It protects and manages your software by storing your software’s secrets and making them readily available as a service without the need for exposure. Vault also generates and encrypts secrets for extra protection, if needed.
Security teams mainly use Vault as it is very configurable for different security approaches, such as end-to-end encryptions, isolation testing, and secure traffic routing.
For access to secrets from code, Vault provides an API used by both the CLI and web GUI interface.
To consume secrets, clients must first prove their identity to gain access to the secrets. While Vault supports common user authentication platforms, such as LDAP and Active Directory, it also adds different methods of establishing an application identity through code based on platform trust, including AWS IAM, Google IAM, Azure Application Groups, TLS Certificates, and Kubernetes namespaces. Vault will provide a short-lived token aligned with a particular set of policies after authentication and depending on certain identification factors, like group membership or project name.
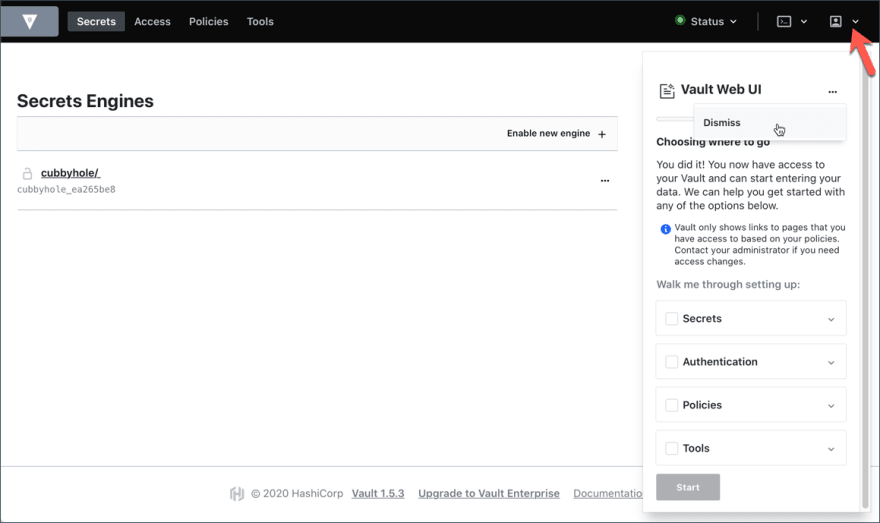
Below is a screenshot of the Vault web UI:
To learn more, visit their official documentation.
Doppler
Doppler is another secrets management tool used by software developers because it makes accessing secrets from code as simple as possible.
Doppler organizes secrets by categorizing them by application or microservice (referred to as “Projects”), with a list of environments for environment-specific variables that you can customize.
When Doppler receives sensitive data, it instantly sends it to its security provider, which tokenizes it with a secure cryptographic function. Once the data has been tokenized, it is used exclusively by all of Doppler’s servers. This action helps to ensure that no sensitive data is ever stored on Doppler’s infrastructure. Furthermore, if Doppler’s infrastructure is compromised, an attacker will only have access to these tokens, which are computationally impossible to reverse back to their original value. Doppler has full support for container architectures, deployment architectures, cloud architectures, and continuous integrations architectures. It features access management for projects in cases where a team is managing the project.
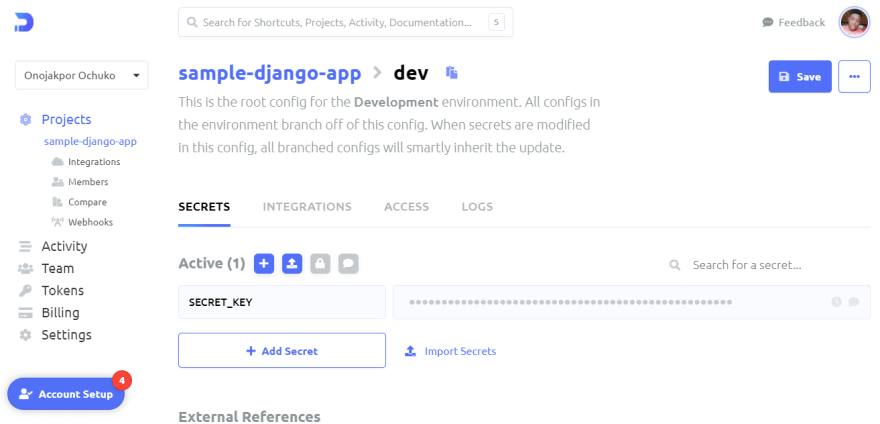
Below is a screenshot of secret keys on the Doppler dashboard:
You can learn more about Doppler through their official documentation.
Loft
Finally, Loft is Kubernetes self-service and multi-tenancy management tool. The creators built it in a way that makes it easy for almost anyone to use, be it a software developer, DevOps engineer, IT operator, or sales specialist. Loft enables you to construct and use virtual clusters. It uses virtual clusters because they are inexpensive and lightweight, therefore increasing their performance and speed.
Loft also provides self-service environment provisioning, which helps users seamlessly set up their namespaces and virtual clusters. It also fully automates tenant isolation by managing network policies and defining security templates that it enforces across all users and teams.
To handle access management in an organization’s structure, Loft uses flexible, isolated namespaces that are easily accessible by anyone who has the appropriate permissions. It also supports its users by providing cost optimization packages, which ensure that users can get the best performance matching their requirements at a minimal cost.
Loft uses both CLI and a local web interface. Below is a screenshot of the Loft user interface.
You can learn more in their official documentation.
Conclusion
Because platform engineers have so many responsibilities, it is easy to become overwhelmed and confused about what tools are needed to best handle a variety of tasks. But no need to worry—most of the research has been done for you.
In this article, you have learned about several helpful tools that could be important to you in your career as a platform engineer. Furthermore, you have reviewed the criteria necessary to evaluate what tools can be most useful. Now you should be well-equipped to explore and implement the platform engineer tools discussed above and others.
Photo by Yannis Papanastasopoulos on Unsplash


Top comments (0)