 photo credit: zbysiu-rodak
Lately, I have been making more broad sweeping changes to this site. I want to ensure that I don't accidentally make a change which slows down the site – especially the homepage. Keeping a web site performant has many benefits including better user experience and affecting search engine rankings.
Google provides a tool call PageSpeed Insights to analyze how quickly a page loads and renders on desktops and mobile devices. According to Google:
PageSpeed Insights analyzes the content of a web page, then generates suggestions to make that page faster.
It also calculates an overall score.
For this site, I want to start by setting a baseline and then regularly measure to make sure I don't do something to drop the score below that baseline performance level. For now, we're only measuring the performance of the homepage.
The Github Action
I found this project which provides a Github Action to run PageSpeed Insights. Thanks Jake!
I wired it up to my blog's Github repo by defining a workflow file .github/workflows/pagespeedinsights.yml:
name: Check Site Performance with PageSpeed Insights

on:
  push:
    branches:
    - master
jobs:
  build:
    runs-on: ubuntu-latest
    steps:
      - name: Running Page Speed Insights
        uses: JakePartusch/psi-action@v1
        with:
          url: "https://mattorb.com"
It kicks off after each commit to the repo. Example results below:

The overall 'performance' desktop score of 99 out of 100 is really good. Nice! I can't take credit for that. The hard work of the Ghost team and the contributors to the default 'Casper' theme put us there.
Now, let us iterate and see what we put together!
See the #comments in the snippets below, which mark what is changing.
Raise the threshold
name: Check Site Performance with PageSpeed Insights

on:
  push:
    branches:
    - master
jobs:
  build:
    runs-on: ubuntu-latest
    steps:
      - name: Running Page Speed Insights
        uses: JakePartusch/psi-action@v1
        with:
          url: "https://mattorb.com"
          threshold: 96 # <--- default was 70
This fails the build if if the overall performance score drops below this number. I'm leaving a tiny bit a wiggle room here for volatility in server response times.
Measure after each blog post
...
on:
  push:
    branches:
    - master
  repository_dispatch: # <-- External event hook
...
We have our Ghost based blog wired up to post a Github repository_dispatch event to trigger a Github action for new/updated posts. See the end of this post for more detail. This is relevant when you are not doing static site generation or have a content management system that manifests changes into a page. In those cases, you need something event based to retrigger an assessment after the site content changes.
Measure once a week
Our web site has some external dependencies and the rules we are measuring against that can evolve outside our immediate control. To catch any unexpected changes in those things, do this once a week, even if we change nothing on our site.
...
on:
  push:
    branches:
    - master
  schedule:
    - cron: '0 13 * * 6' # <---- once a week
  repository_dispatch:
...
Hat tip to crontab.guru re: 0 13 * * 6
Measure both desktop and mobile page speed
...
    steps:
      - name: Running Page Speed Insights (Mobile) # <-- new step
        uses: JakePartusch/psi-action@v1
        id: psi_mobile
        with:
          url: "https://mattorb.com"
          threshold: 90 # <-- distinct threshold
          strategy: mobile # <-- different strategy
      - name: Running Page Speed Insights (Desktop)
        uses: JakePartusch/psi-action@v1
        id: psi_desktop
        with:
          url: "https://mattorb.com"
          threshold: 96
          strategy: desktop
...
If you use an action with the same 'uses' clause, twice, you have to give each step a unique 'id'.
Wrapping up
Here's the workflow file for my Github Action, in full:
name: Check Site Performance with Page Speed Insights

on:
  push:
    branches:
    - master
  schedule:
    - cron: '0 13 * * 6'
  repository_dispatch:
jobs:
  build:
    runs-on: ubuntu-latest
    steps:
      - name: Running Page Speed Insights (Mobile)
        uses: mattorb/psi-action@v1
        id: psi_mobile
        with:
          url: "https://mattorb.com"
          threshold: 90
          strategy: mobile
      - name: Running Page Speed Insights (Desktop)
        uses: mattorb/psi-action@v1
        id: psi_desktop
        with:
          url: "https://mattorb.com"
          threshold: 96
          strategy: desktop
For every commit, every blog post, every theme change, and once a week a mobile and desktop Page Speed Assessment measures how the mattorb.com home page performs and alerts us if something degrades significantly.
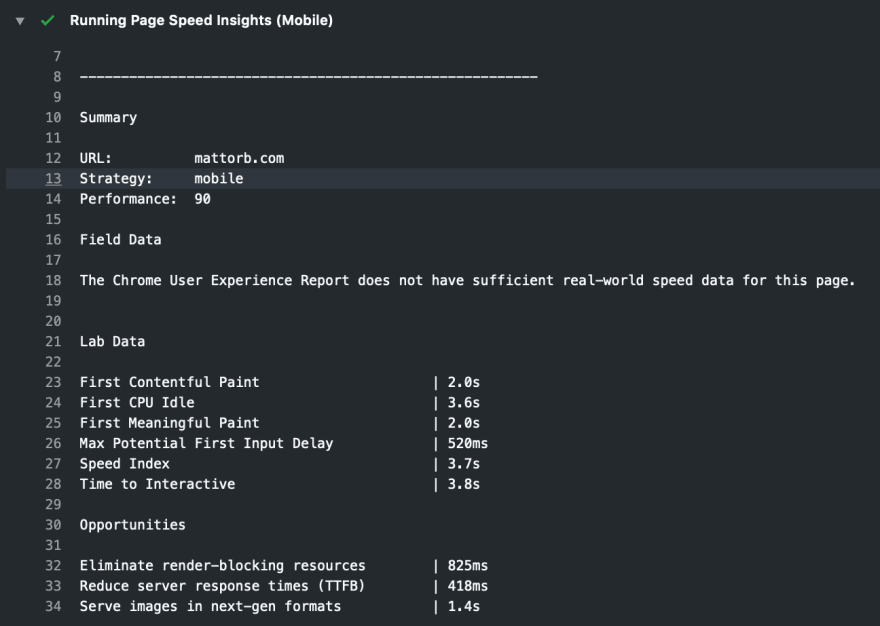
We also get history of the results of the performance measurements stored in the actions tab on Github, which can be super helpful in understanding which of the several things that is measured has degraded in performance.
When you browse to examine those results you can see this level of detail:


Fun stuff! Some potential improvements lie in the 'Opportunities' section of the report and making something run this test on several (or all) pages throughout the site.
Performance is one of those things that is a lot easier to keep going once you have a baseline established and some tools to help track and understand what causes changes in it.


Top comments (0)