Last time we saw how to send our metrics to Prometheus. This time, we'll send them to a StatsD server.
What's StatsD?
StatsD is a network daemon that listens for statistics, like counters and timers, sent over UDP or TCP and sends aggregates to one or more pluggable backend services.
StatsD does aggregation of data.
To visualize the data you need another tool. For example, to create graphs from the aggregated data you can use Graphite.
StatsD forwards aggregated data to
What's Graphite?
Graphite does two things:
- Store numeric time-series data
- Render graphs of this data on demand
In summary, StatsD collects and aggregates metrics and then sends them to Graphite to be rendered in nice graphs.
In this tutorial we'll send our Elixir metrics to StatsD and then we'll use the Graphite dashboard to see the graphs generated from our metrics.
Install StatsD and Graphite
There is a way to install separately StatsD server and Graphite but for this tutorial, I'll just use the official Graphite docker image that also includes the StatsD server.
In a terminal run:
docker run -d \
 --name graphite \
 --restart=always \
 -p 80:80 \
 -p 2003-2004:2003-2004 \
 -p 2023-2024:2023-2024 \
 -p 8125:8125/udp \
 -p 8126:8126 \
 graphiteapp/graphite-statsd
This will start the StatsD on port 8125 and the Graphite dashboard on port 80.
Let's add some sample data just to check that the graphs render correctly.
Evaluate this on another terminal:
echo "foo:2|c" | nc -u -w0 127.0.0.1 8125
Wait at least 10 seconds and then run this:
echo "foo:4|c" | nc -u -w0 127.0.0.1 8125
We have sent two counter values separated by at least 10 seconds.
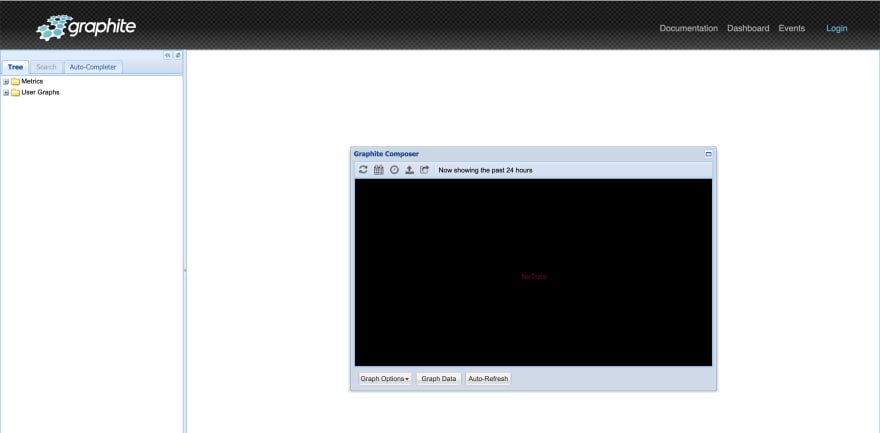
Let's open a browser and go to http://localhost. You'll see something like this:
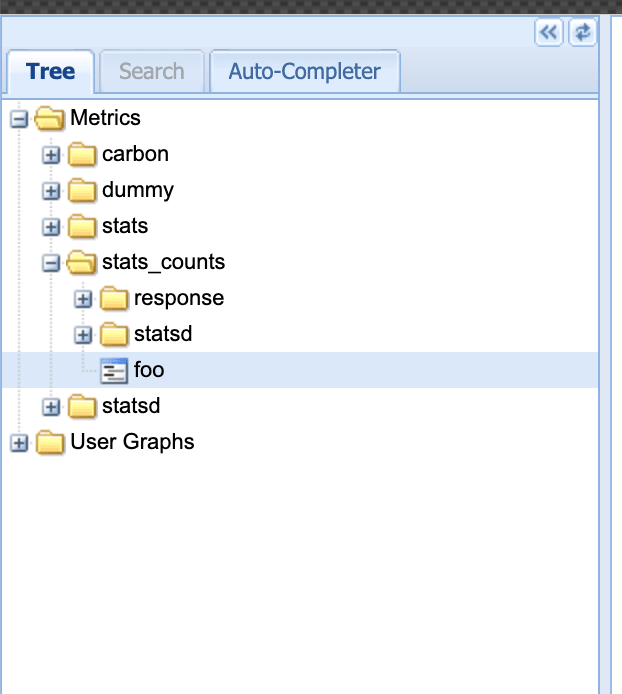
On the left panel expand the tree (Metrics -> stats_count) and select the foo entry.
You'll see the graph on the main panel populated with some data. But it is too difficult to see the data. Let's change the resolution of the graph.
Click on the clock icon:
And select a time range of 10 minutes. Now you can see clearly the two data points we send to StatsD:
Why we had to wait 10 seconds in the previous examples? It is because that's the default flush interval timeout that StatsD waits before aggregating the stats and sending them to Graphite.
Try sending this data one after the other without any delay:
echo "foo:3|c" | nc -u -w0 127.0.0.1 8125
echo "foo:5|c" | nc -u -w0 127.0.0.1 8125
If you go to the graph and click the Auto-Refresh button, you'll see that a new value appears on the graph, but the value is 8, that, as you can tell is the sum of 3 and 5 that we sent. StatsD aggregated all the values inside a flush interval and sent the result to Graphite.
Ok, enough with StatsD and Graphite. Let's do some Elixir.
Send Elixir metrics to StatsD
Let's continue using the project we created for this series. Clone it from here if you don't have it. We'll start working on the main branch
Add the :telemetry_metrics_statsd dependency to mix.exs:
  defp deps do
    [
      {:telemetry, "~> 1.0"},
      {:telemetry_metrics, "~> 0.6.1"},
      {:telemetry_metrics_statsd, "~> 0.6.0"}
    ]
  end
and run mix deps.get
Now edit the telemetry.ex file and add the TelemetryMetricsStatsd reporter to the list of children:
  def init(_arg) do
    children = [
      {TelemetryMetricsStatsd, metrics: metrics()}
      {Metrics.Telemetry.CustomReporter, metrics: metrics()}
    ]

    Supervisor.init(children, strategy: :one_for_one)
  end
Now our metrics will be also sent to the StatsD server. By default the TelemetryMetricsStatsd reporter sends the data to 127.0.0.1:8125, but you can configure the host and port passing additional :host and :port options.
One thing to know is that the reporter doesn't aggregate metrics. It just forwards them to StatsD and it is StatsD the one that will do the aggregation before sending the data to Graphite.
Let's generate some metrics. Start the application:
iex -S mix
and run this:
1..80 |> Enum.each(&Metrics.emit(&1))
Wait at least 10 seconds and then run:
1..100 |> Enum.each(&Metrics.emit(&1))
If you navigate the left pane and visualize the stats_count.metrics.emit.value you'll see a graph like the following, showing that the aggregated values in two subsequent intervals are 80 and 100. This is because we generated 80 metric events in the first flush interval and after 10 seconds we generated another 100 events in the second flush interval:
If you now visualize the stats.gauges.metrics.emit.value you'll see the sum metric values.
You'll see that in the first interval the value is 3240: the sum of the first 80 events.
In the second interval, the value is 8290: the sum of the next 100 events.
Now our application is using a new reporter to send the metrics to a StatsD server and we are using Graphite to visualize the metrics in configurable graphs.
There is no limit to the amount of data you can send to StatsD and visualize it with Graphite. You can also configure Graphite and save graphs arranged in dashboards so that you can see your data all together in a simple place
You can find the code for this article in the metrics-statsd branch in the github repo.
About
I'm Miguel Cobá. I write about Elixir, Elm, Software Development, and eBook writing.
- Follow me on Twitter
- Subscribe to my newsletter
- Read all my articles on my blog
- Get my books:


Top comments (0)