This article introduces multiple approaches to building an internal data application using google sheets as the backend. In addition to summarizing the advantages and disadvantages of each approach, we will also discuss the differences from the perspective of AI functionality, which has been gaining increasing demand.
Many teams manage their daily data using Google Sheets due to its high convenience. But when you decide to build a data application using google sheets as the backend, what are your options?
Code-Based / Low-Code / No-Code
The methods for building an internal data application can be categorized into three approaches: code-based development, low-code tools, and no-code tools. Below are the descriptions and representative tools for each approach.
Code-Based
This approach involves building a data application with code. While it requires coding, the frameworks introduced below provide pre-built components that enable rapid development. Additionally, since they are open-source, you can choose your deployment environment.
[Representative Tools]
- Streamlit: https://streamlit.io/
- Evidence: https://evidence.dev/
- Morph: https://www.morph-data.io/
Low-Code
This approach combines coding and GUI-based development. For simple applications with minimal functionality/UI, it is possible to build using only the GUI, while some parts can be customized with code. Compared to no-code, low-code allows for more flexibility, but it still has limitations compared to full code-based development.
[Representative Tools]
- Appsmith: https://www.appsmith.com/
- Retool: https://retool.com/
- OutSystems:https://www.outsystems.com/?sc_lang=en
No-Code
This approach allows users to build data applications entirely through GUI-based tools, making it accessible to non-engineers. However, it has significant limitations in terms of handling complex processing and UI customization. Additionally, the development skill is heavily dependent on familiarity with the specific tool, making knowledge transfer a challenge.
[Representative Tools]
- AppSheet: https://about.appsheet.com/home/
- Glide: https://www.glideapps.com/
- Softr: https://www.softr.io/
Compatibility with AI Features
One of the most significant emerging needs is AI integration. Let’s examine how well each category supports AI functionality.
Code-Based
With a code-based approach, you can leverage open-source AI frameworks such as Langchain and CrewAI, allowing for the highest level of flexibility in AI development. This approach supports model switching, fine-tuning with custom datasets, and other advanced AI functionalities. Since internal business workflows vary widely between companies and often involve complex logic, this approach is the most recommended for building AI-powered applications tailored to your business needs.
Low-Code
In general, AI functionality in low-code platforms relies on pre-integrated external APIs. While parameters and prompts can be tuned, you cannot perform additional training with new datasets or freely select AI models. This makes low-code a suitable choice for single-task AI use cases but limits its flexibility. Therefore, the AI compatibility of low-code is considered moderate.
No-Code
With a no-code approach, you can only use the AI features provided by the platform. While these features are easy to use, they lack customization options, making them useful only for specific use cases. No-code is ideal for Proof of Concept (PoC) and quick experiments, but for building production-ready applications, AI compatibility is low.
Comparison of Code-Based Frameworks
Next, let’s focus on code-based frameworks and try building a simple application using google sheets as the backend. For this example, we will create a dashboard to manage user inquiry data stored in a spreadsheet.
Streamlit
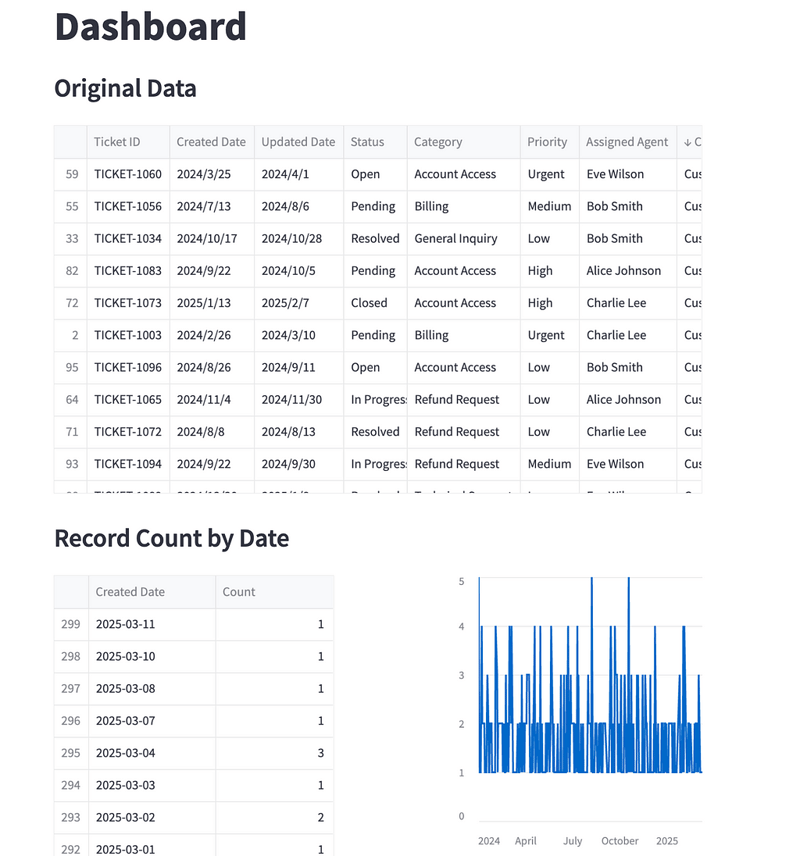
First, we will build the application with Streamlit. Streamlit allows you to complete the development using a single Python file.
import streamlit as st
from google.oauth2 import service_account
import gspread
import pandas as pd
import matplotlib.pyplot as plt
import seaborn as sns
from datetime import datetime
# Add a title to the app
st.title('Dashboard')
# Google Sheets Authentication
scopes = [ 'https://www.googleapis.com/auth/spreadsheets', 'https://www.googleapis.com/auth/drive'
]
json_file_path = os.path.join(os.path.dirname( __file__ ), "../credential.json")
credentials = service_account.Credentials.from_service_account_file(json_file_path, scopes=scopes)
gc = gspread.authorize(credentials)
# Get data from Google Sheets
SP_SHEET_KEY = '{Sheet ID}' # sheet id (which can be found in the URL of the Google Sheet, after https://docs.google.com/spreadsheets/d/)
sh = gc.open_by_key(SP_SHEET_KEY)
SP_SHEET = 'test' # Sheet name
worksheet = sh.worksheet(SP_SHEET)
data = worksheet.get_all_values() # Get all data from the sheet
df = pd.DataFrame(data[1:], columns=data[0]) # Convert data to DataFrame
# Display original DataFrame (limited to 100 rows with scrolling)
st.subheader('Original Data')
st.dataframe(df.head(100), height=400) # height parameter adds scrolling capability
# Check if 'Created Date' column exists
if 'Created Date' in df.columns:
 # Convert to datetime format (adjust format as needed)
 df['Created Date'] = pd.to_datetime(df['Created Date'])

 # Group by date and count records
 count_by_date = df.groupby(df['Created Date'].dt.date).size().reset_index()
 count_by_date.columns = ['Created Date', 'Count']

 # Sort by Created Date in descending order
 count_by_date = count_by_date.sort_values('Created Date', ascending=False)

 # Create two columns for side-by-side display
 st.subheader('Record Count by Date')
 col1, col2 = st.columns([3, 2]) # Adjust the ratio to make the first column wider

 # Display grouped DataFrame in the first column
 with col1:
 st.dataframe(count_by_date.head(100), height=400)

 # Create line chart in the second column
 with col2:
 # For the chart, we need to sort by date in ascending order
 chart_data = count_by_date.sort_values('Created Date', ascending=True)
 st.line_chart(chart_data.set_index('Created Date'))
else:
 st.error("'Created Date' column not found in the DataFrame. Please check the column name.")
 st.write("Available columns:", df.columns.tolist())
Evidence
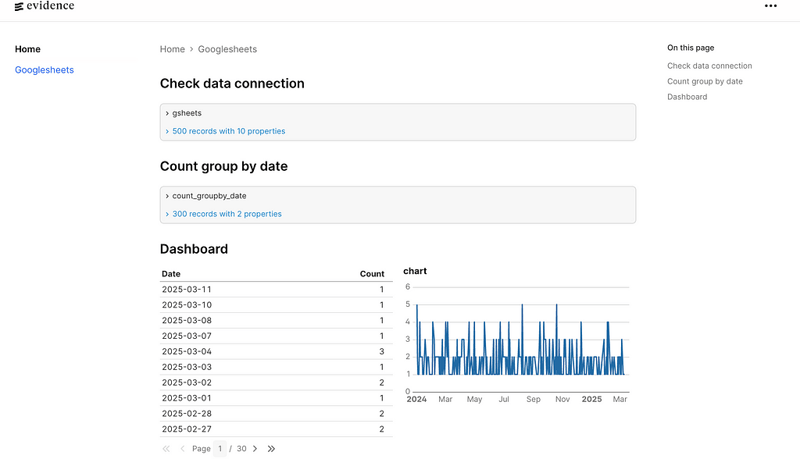
Next, let’s try Evidence. Evidence is built with the SvelteKit JavaScript framework, so you need a Node.js environment to use it.
## Check data connection
``sql gsheets
select * from googlesheets.test_test
``

## Count group by date
``sql count_groupby_date
select "Created Date" as date ,
        count(*) as count
from googlesheets.test_test
     group by "Created Date"
     order by "Created Date" DESC
``

## Dashboard
<Grid cols=2>
    <DataTable data={count_groupby_date}/>

    <LineChart
        data = {count_groupby_date}
        y = count
        title = 'chart'
    />
</Grid>
The app will look like this. One nice touch is that the SQL source code is displayed alongside it.
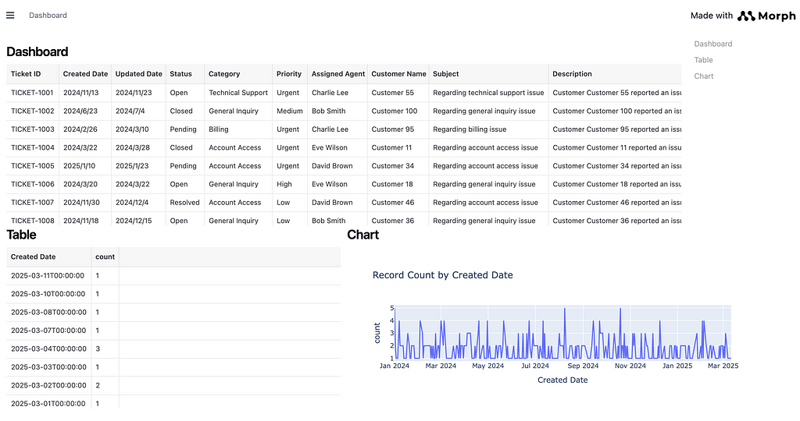
Morph
Finally, we will use the Morph framework. Morph is unique in that it allows you to structure your application using separate Python and Markdown files. Additionally, Python functions are written in a standard function format, making it easier to learn.
# Get spreadsheet data

import pandas as pd
import gspread
from oauth2client.service_account import ServiceAccountCredentials
import os
import morph
from morph import MorphGlobalContext
@morph.func
def get_gsheets(context: MorphGlobalContext):
    # Configure authentication information
    json_path = os.path.join(os.path.dirname( __file__ ), "../credential.json")
    scope = ['https://spreadsheets.google.com/feeds', 'https://www.googleapis.com/auth/drive']
    # get certification information
    credentials = ServiceAccountCredentials.from_json_keyfile_name(json_path, scope)
    client = gspread.authorize(credentials)
    # Open Spreadsheet
    spreadsheet = client.open_by_key("Sheet ID")
    worksheet = spreadsheet.worksheet("Sheet name")
    # Get data and convert to a DataFrame
    data = worksheet.get_all_values()
    df = pd.DataFrame(data[1:], columns=data[0])
    return df
## Display of aggregated table

import pandas as pd
import morph
from morph import MorphGlobalContext
@morph.func()
@morph.load_data("get_gsheets")
def group_by_date(context: MorphGlobalContext):
    df = context.data["get_gsheets"]
    # Group by Created Date and count records, then sort by date in descending order
    grouped_df = df.groupby('Created Date').size().reset_index(name='count')
    grouped_df = grouped_df.sort_values('Created Date', ascending=False)
    return grouped_df
# Display of Chart

import plotly.express as px
import pandas as pd
import morph
from morph import MorphGlobalContext
@morph.func()
@morph.load_data("group_by_date")
def group_by_date_chart(context: MorphGlobalContext):
    df = context.data["group_by_date"]
    df['Created Date'] = pd.to_datetime(df['Created Date'])
    df['count'] = pd.to_numeric(df['count'], errors='coerce')
    # Create a line chart using plotly
    fig = px.line(df, x='Created Date', y='count', title='Record Count by Created Date')
    return fig.to_html()
{/* Frontend */}
## Dashboard
<DataTable
  loadData="get_gsheets"
  height={300}
 />
<Grid cols="2">
    <div>
        ## Table
        <DataTable
            loadData="group_by_date"
            height={300}
        />
    </div>
    <div>
        ## Chart
        <Embed
            loadData="group_by_date_chart"
            height={300}
            width={800}
        />
    </div>
</Grid>
Summary of Comparisons
If you are familiar with Python, Streamlit and Morph will feel the most intuitive. If you are a data analyst proficient in SQL but not experienced with Python, you might prefer Evidence.
For dashboard applications, Evidence is a strong option because it provides many pre-built chart components, reducing the amount of code needed. If you need additional AI functionalities or features beyond dashboards, Streamlit or Morph would be better choices.
If you want maximum flexibility in UI customization, Morph stands out because it allows you to create custom React components and apply styling flexibly using MDX files.
Pros, Cons, and Recommended Use Cases
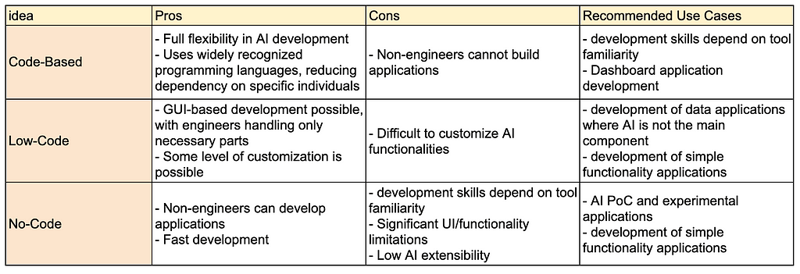
Conclusion
When comparing no-code, low-code, and code-based approaches for developing data applications with google sheets as the backend, there is a trade-off between flexibility, speed, and engineering requirements. For simple single-function applications or PoC use cases, no-code and low-code are viable options due to their speed. However, for building enterprise-grade internal data applications that meet specific operational needs, code-based approaches are more advantageous.
Considering the increasing demand for AI integration, Python frameworks such as Streamlit and Morph are strong contenders for future-proof data applications. Give them a try and see which one fits your needs!

Top comments (2)
Hi, my question would be why would someone use google sheets instead of database for building.
Regards
good article. Just one suggestion. Please get the code tested by someone. There isn't any info about credentials.json file.