** Introduction to Pandas**
Pandas is basically a Python library that is used for analyzing, cleaning, exploring, and manipulating data. Pandas allow us to analyze big data and make conclusions based on statistical theories. Pandas can clean messy data sets, and make them readable and relevant. Relevant data is very important in data science.
Installation and importing Pandas.
First of all, open your jupyter notebook, then go to your command panel and write “pip install Pandas”. Here we go, you are done with the installation of the Pandas library. Now, to use the Pandas library you need to import Pandas in your notebook, to do so write “import Pandas as PD”. You are ready to use Pandas Library.
Finally, check if the installation was successful.
import pandas as pd
print(pd.version)
Getting Started with Pandas
Series
A series can actually hold pretty much almost all types of data
objects with python as its data point. Series also can take lots of parameters (data, index, dtype, name, copy, fastpath). To create a pandas series we just need a list initially it will generate random index we can also manipulate index by sending a list of index with the index parameter.
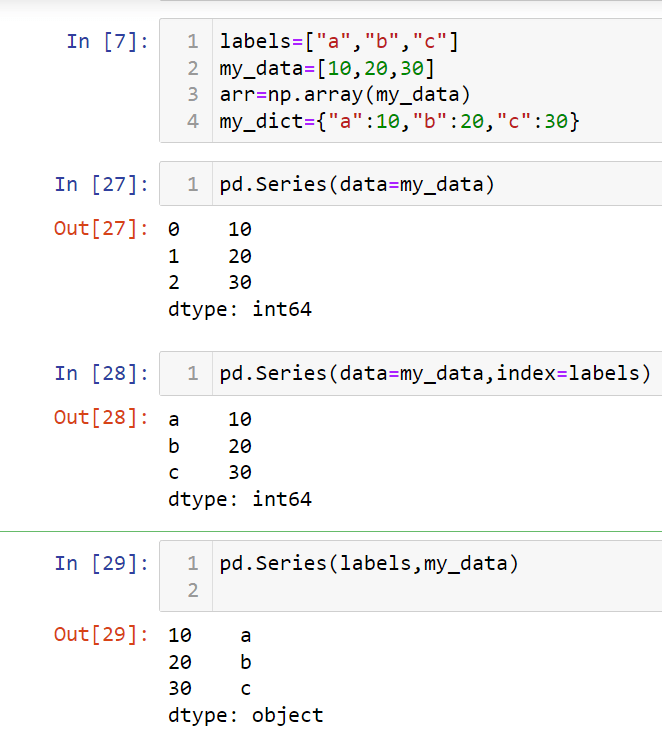
Just look at the picture above. we have used an integer list and series automatically generated index but in the 2nd and 3rd series we have customized the index as we wanted that's the beauty of Pandas.
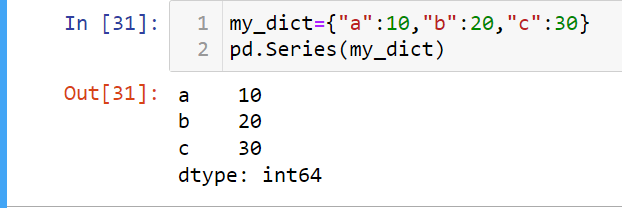
We can also use a dictionary and Pandas series will use its key as index .
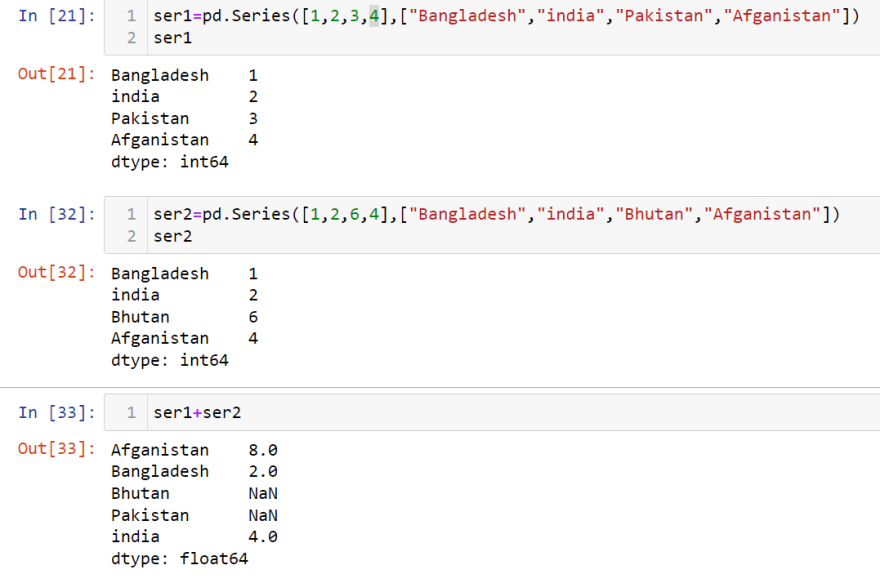
Use the index option to specify only the words you wish to be included in the Series, leaving out the rest of the words in the dictionary. Two series can added.
Data Frames
Data Frame is known as the main tool of Pandas. It takes multiple parameters like data, column, rows, dtype, copy. To start with Data Frames we have some necessary setting in our Jypyter. As we don't have any specific data so, we will use random data to learn Data Frames.
import numpy as np
import pandas as pd
from numpy.random import randn
np.random.seed(101)
df=pd.DataFrame(randn(5,4),["A","B","C","D","E"],["X","Y","Z","P"])
df
output
       X           Y           Z          P
A   2.706850    0.628133    0.907969    0.503826
B   0.651118    -0.319318   -0.848077   0.605965
C   -2.018168   0.740122    0.528813    -0.589001
D   0.188695    -0.758872   -0.933237   0.955057
E   0.190794    1.978757    2.605967    0.683509
Data Frames is just bunches of series. we can access those series by following command.
 **df["X"]
output
    X          Y
A   2.706850    0.628133
B   0.651118    -0.319318
C   -2.018168   0.740122
D   0.188695    -0.758872
E   0.190794    1.978757
more than one series is a data frames
**df[["X","Y"]]
        X         Y
A   2.706850    0.628133
B   0.651118    -0.319318
C   -2.018168   0.740122
D   0.188695    -0.758872
E   0.190794    1.978757
we can also add or drop any column.
To add any column.
df["updated"]=df["X"]+df["Y"]
df["updated"]

A    3.334983
B    0.331800
C   -1.278046
D   -0.570177
E    2.169552
it will add the number column x and y and create a column which will be added as updated.
To drop any column.
df.drop("updated",axis=1,inplace=True)
df
         X          Y          Z        p
A   2.706850    0.628133    0.907969    0.503826
B   0.651118    -0.319318   -0.848077   0.605965
C   -2.018168   0.740122    0.528813        -1.278046
D   0.188695    -0.758872   -0.933237   0.955057
E   0.190794    1.978757    2.605967    0.683509
as we have set inplace as true so the updated column will drop permanently.
we can also add or drop any rows or columns by using this command.
df.drop("D")
we just have to put the row or column name and it will be droped automatically.
we can check dimension of a data frames by
df.shape
Conditional selection in Data Frames
df>0
output
      X     Y       Z        P      updated
A   True    True    True    True    True
B   True    False   False   True    True
C   False   True    True    False   False
D   True    False   False   True    False
E   True    True    True    True    True
we can also specify only false value
booldf=df>0
df[booldf]
output
       X            Y           Z            P
A   2.706850    0.628133    0.907969    0.503826
B   0.651118    NaN          NaN            0.605965
C   NaN         0.740122    0.528813    NaN
D   0.188695    NaN          NaN           0.955057
E   0.190794    1.978757    2.60596     2.169552
we can also use specific rows or column or both
df["X"]>0
starting with multiple conditions
df[(df["X"]>0) | (df["Y"]>1)]
** skipping index reset it's bit harder to explain index reset in that blog.
Pipe Index Oparetor
index level
a="G1 G1 G1 G2 G2 G2".split()
outside=a
inside=[1,2,3,1,2,3]
higher_index=list(zip(outside,inside))
higher_index=pd.MultiIndex.from_tuples(higher_index)
now we can use that pipe index to built a multi level index
df=pd.DataFrame(randn(6,2),higher_index,["A","B"])
to get sub data frames from a multilevel index
df.loc["G1"]
df.loc["G1"].loc[1]
Missing Data
d={"A":[1,2,np.nan],"B":[1,np.nan,np.nan],"C":[1,2,3]}
df=pd.DataFrame(d)
output
       A    B   C
0   1.0 1.0 1
1   2.0 NaN 2
2   NaN NaN 3
to drop any row that hold missing data
df.dropna()
it will drop that rows that has one or more NaN value
df.dropna(axis=1)
it will drop that coloum that has one or more NaN value
to fill any missing data
df.fillna(value="FIll VALUE")
to chnage specific value
df["A"].fillna(value=3)
mean function
df["A"].fillna(value=df["A"].mean())
GROUP BY
all functions of group by
data={"Company":["GOOG","GOOG","ghgh","fdff"],"Persoon":["Mridul","Mohosin","Sabid","Raihan"],"Sales":[10,12,34,45]}
df=pd.DataFrame(data)
df
bycomp=df.groupby("Company")
to find minimun valuee
bycomp.mean()
total sell of a company
bycomp.sum()
standered division
bycomp.std()
to see sells of a specific company
bycomp.sum().loc["GOOG"]
df.groupby("Company").sum().loc["GOOG"]
df.groupby("Company").count()
df.groupby("Company").max()
df.groupby("Company").min()
df.groupby("Company").describe()
df.groupby("Company").describe().transpose()
df.groupby("Company").describe().transpose()["GOOG"]
merging,joining,concatenating
dic={
    'col1':[1,2,3,4,5],
    "col2":[45,5,77,88,5],
    "col3":["abc","def","ghi","jkl","mno"],
}
df=pd.DataFrame(dic)
df.head()
to find unique values in a specific coloum
df["col2"].unique()
it will return a arrays with unique values
we can aslo check the lenght of that array by len function
len(df["col2"].unique())
nunique is an alternatives of len function
df["col2"].nunique()
unique value count method
df["col2"].value_counts()
filtering data using conditional statement
df[df["col1"]>2]
pandas can use customizer function


Top comments (0)