Monitoring and alerting are essential aspects to any production software system. An effective monitoring solution aggregates data across a range of metrics and presents it in a readable, human-friendly manner. A useful monitoring dashboard might allow you to quickly answer questions around high-level statistics such as "how many users have signed up for our application today" or "how many Lambda invocations have resulted in errors over the last hour". On the other side of the coin, a good alerting system will allow you to respond to changes in these metrics, perhaps by notifying an on-call engineer that something has gone wrong.
In the fast-paced development environment of the Serverless Framework, our preferred tool of choice for applications deployed to AWS Lambda with API Gateway, it's easy to forget about building a robust monitoring or alerting solution. Fortunately, it is also relatively straightforward to do so, thanks to the vast array of metrics available by default in AWS CloudWatch.
CloudWatch metrics
A good set of metrics forms the basis of any monitoring or alerting system. CloudWatch exposes metrics from a wide range of AWS services, including those commonly used in a Serverless application such as API Gateway, Lambda, Cognito and DynamoDB. You can experiment with various representations of the available metrics from the CloudWatch console. Note that you do not have to do anything to get these metrics flowing into CloudWatch. AWS handles it all for you.

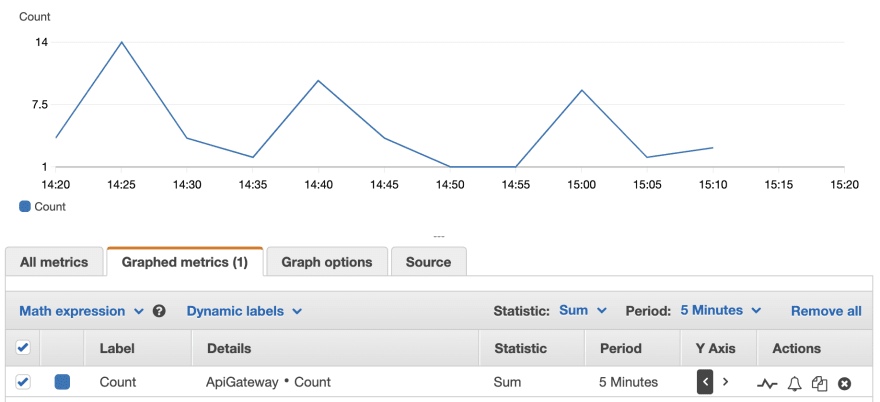
The AWS CloudWatch console graphing an API Gateway metric
Metrics can be visualised in a number of ways, including graphs as shown in the above screenshot, and these visualisations can be added to CloudWatch dashboards for quick at-a-glance monitoring. However, this requires you to be physically watching the screen to spot any possible anomalies. There must be a better way!
CloudWatch alarms
Alarms are the mechanism exposed by CloudWatch to build an automated alerting system. They can be configured to respond to changes in any of the metrics we previously explored by notifying an SNS topic of the change. SNS topics are flexible and allow a range of automatic responses, such as sending an email to a specific address, and custom handlers built on AWS Lambda.
CloudFormation has good support for CloudWatch so it's possible to write your alerting system infrastructure as code in the "custom resources" section of a Serverless Framework project. The following example configures a CloudWatch alarm that will trigger when any number of 5xx errors are detected by a specific API Gateway stage.
Resources:

  ApiGatewayAlarm5xx:
    Type: AWS::CloudWatch::Alarm
    Properties:
      AlarmDescription: 5xx errors detected at API Gateway
      Namespace: AWS/ApiGateway
      MetricName: 5XXError
      Statistic: Sum
      Threshold: 0
      ComparisonOperator: GreaterThanThreshold
      EvaluationPeriods: 1
      Period: 60
      Dimensions:
        - Name: ApiName
          Value:
            Fn::Join:
              - "-"
              -
                - Ref: ApiGatewayStage
                - ${self:service}
        - Name: Stage
          Value:
            Ref: ApiGatewayStage
Some of the important properties here can be explained as follows:
-
Namespace- the AWS service namespace whose metric you want to alert on. The available namespaces are listed in the documentation. -
MetricName- the specific metric you want to alert on. These are usually listed somewhere in the documentation for the service in question. For example, API Gateway lists them here.
The Statistic, Threshold and ComparisonOperator properties define a change in metric state that will trigger the alarm. In this case the alarm will trigger if the 5XXError metric exceeds a total of 0 over the Period (a value in seconds).
The Dimensions property effectively restricts the alarm to a subset of available metrics. In this example the alarm will only trigger for a specific stage of a specific API Gateway. If you have multiple stages or APIs deployed in a single account it will be important to ensure your alarms are specific enough to not trigger false positives.
Adding actions to alarms
With the example configuration above we have a CloudWatch alarm configured and it will successfully transition between states as the value of the underlying metric changes. To make this alarm a useful part of our monitoring and alerting strategy we need to add an action to it.
In a Serverless application it is likely that the action will always be a notification to an SNS topic. Other actions include certain EC2 and Auto Scaling actions which are outside the scope of this article. Like the CloudWatch alarm itself, an SNS topic can be codified in CloudFormation:
Resources:

  TopicCloudwatchAlarm:
    Type: AWS::SNS::Topic
    Properties:
      TopicName: ${self:service}-${self:custom.stage}-topic-cloudwatch-alarm
An SNS topic needs a "subscription" to be useful. SNS topics are capable of automatically sending emails to a given address for every message published to them. We can add a subscription in CloudFormation too. In this example the TopicArn property references the TopicCloudwatchAlarm resource defined above via the Ref function:
Resources:

  TopicCloudwatchAlarmSubscription:
    Type: AWS::SNS::Subscription
    Properties:
      Endpoint: alerts@example.com
      Protocol: email
      TopicArn:
        Ref: TopicCloudwatchAlarm
With these resources deployed to AWS any message published to the new SNS topic will be sent to the email address specified by the SNS subscription. All that remains is for us to connect the CloudWatch alarm to the SNS topic. The AlarmActions property on the CloudWatch alarm resource takes the ARN of the
SNS topic. Add the following to the original example to wire it all up:
  AlarmActions:
    - Ref: TopicCloudwatchAlarm
All that remains is to trigger the alarm and check your inbox!

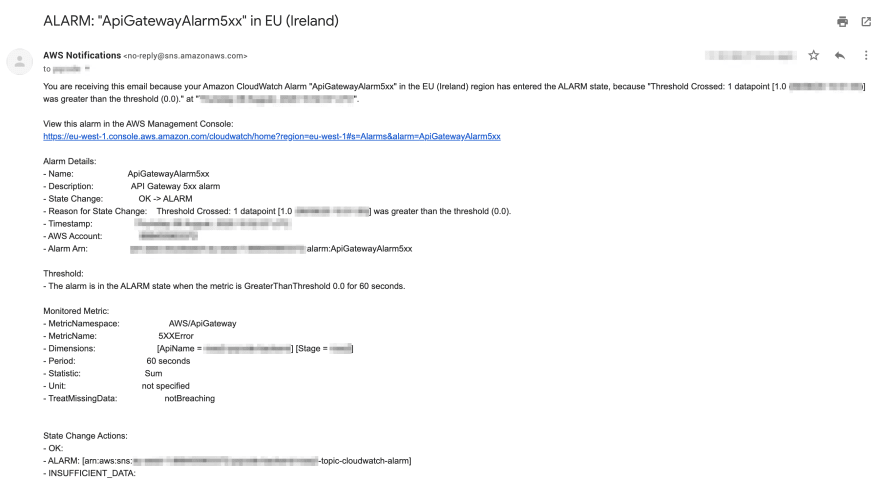
An email sent in response to a CloudWatch alarm
Next steps
The alarm we've looked at in this article barely scratches the surface of what's possible with CloudWatch. You can create alarms that take many metrics into account at once. You can create alarms to warn you when an AWS resource is costing more money than you would like. You can even configure alarms based on "anomaly detection" where CloudWatch will analyse past metric data to create a model of expected values and alert on deviations from that baseline. As with most AWS services, the CloudWatch documentation is helpful and is definitely recommended reading if you'd like to learn more about these more advanced alarms.


Top comments (0)