Chances are that if you have seen a piece of data visualization on the web you have come across D3. It’s heavily used by organizations like The New York Times to produce wonderful graphics that engage their readers and enhances their stories.
TL;DR Together with Qlik you can create very lean data visualizations using D3, letting D3 bind the data to the DOM and draw visualizations. Letting Qlik perform the heavy lifting in terms of data manipulation and a reactive data flow, abstraction away data state management from D3.
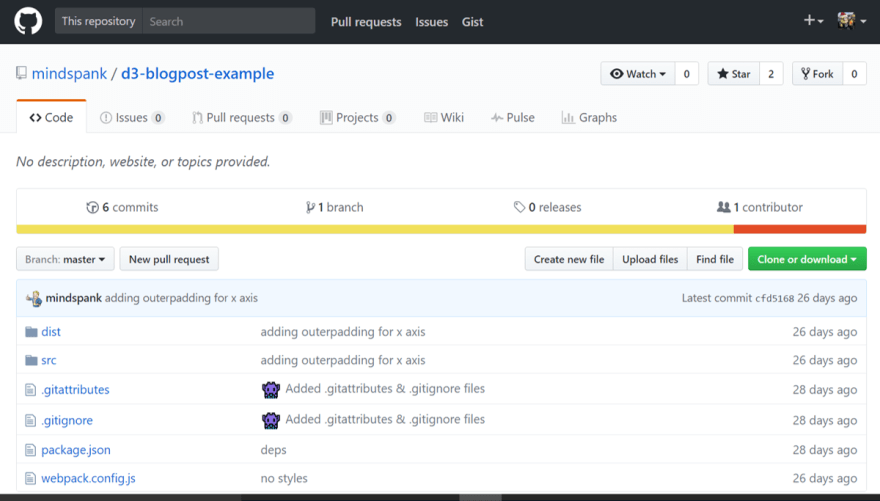
Sample project: https://github.com/mindspank/d3-blogpost-example
Ironically, while you can create wonderful data visualizations using D3 it is not a data visualization library. It has no bar chart or line chart methods. Instead it focuses on binding data to the DOM and performing manipulations of the document based on data. The data binding paired with additional components such as layout algorithms and components such as scales and axis makes it a perfect library for general purpose data visualization.
Where D3 suffers is when you have many visualizations on the page that you want to keep in sync, manipulating larger data sets and having to fetch the full data sets to calculate a proper scale.
// Looks familiar?
d3.scaleLinear()
    .range([height, 0])
    .domain([0, d3.max(data, function(d) { return d.value; })]);
Qlik to the rescue!
Luckily the Qlik Associative Engine is a blazingly fast in-memory computation engine that provides tons of useful metadata around your data geared towards building visualization components.
By letting Qlik take care of the data computation you can omit heavy data wrangling on the client and push those calculations onto the server, leaving you with very lean front-end code that focuses on what D3 does best; binding data to the DOM and outputting a visualization representation of that data.
To cherry pick a few nuggets that Qlik gives you out of the box:
- Minimum and maximum values for calculations for scale inputs
- Glyph counts for the longest dimensional value for label widths
- Data reduction for “glanceable” visualizations
- Server-side configurable sorting and formatting
Most of the points above D3 handles quite fine, however for larger datasets it’s quite taxing on the browser to crunch all those numbers.
However, for me personally, the biggest win is that I can write code that is readable, neat and doesn’t mutate my data.


Top comments (0)