Like all of us, we've been observing the spread of Coronavirus (COVID-19) with great concern. Our thoughts are with everyone affected, and we are grateful to all the health workers and public safety officials who allow us to survive.
Reasons
Recently we've reloaded our Dataflow Kit framework, which is now, I believe🙏🏼, become more focused and more understandable for our users.
The challenge is to find out how much time and effort it would take us to complete creating the code which can
- Extract actual data from the trustable COVID-19 source.
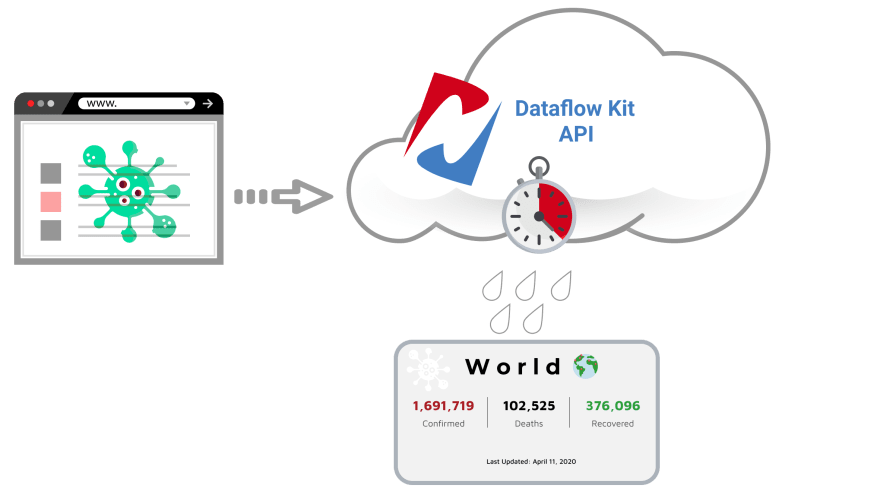
- Make extracted data available to others through the API.
- Create JavaScript web widgets that consume data from the API layer.
Running ahead, it took us about a day to complete a draft covering all 3 stages without the design of cards. 👻
On the other hand, we need to take a test drive of our re-implemented core services like Visual Data Selector and Headless Chrome service running in our cloud.
Stage 1. Extract data from the source.
We watched the Worldometers website for quite some time and found it to be an excellent source of COVID-19 data. So we choose it finally as a source.
We use point-and-click Visual Data Selector to select desired data from the Worldometers' table. We can preview the extracted data several times until we satisfied with the results. We have to be sure we've chosen the right CSS selectors from the source HTML web page. As a result, we generate the payload, which is used for requesting the source web page periodically and grabs new data.
Check out the first article in the series for more details.
Stage1: How to scrape COVID-19 cases?
Stage 2. Coronavirus Tracker API.
At this stage, we develop a simple HTML server written in GO.
The server sends requests periodically to Dataflow Kit API endpoint at https://api.dataflowkit.com/v1/parse with the previously generated payload.
At the same time, we make a code to handle 2 endpoints for us:
GET /v1 - List all COVID-19 cases.
GET /v1/{cntr} - Get COVID-19 cases for a specified country.
Available {cntr} values: world, USA, spain, Slovakia and etc.
We run our open API at
https://covid-19.dataflowkit.com/v1
https://covid-19.dataflowkit.com/v1/world
You may use it absolutely for free.
Read more about this part at
Stage2: Coronavirus Tracker API.
Stage 3. Coronavirus live statistics free widgets.
Finally, we create web widgets. They visualize Coronavirus (COVID-19) live statistics coming from the API layer.
After placing a widget on any website, it shows live statistics local to a visitor depending on one's location.
Check out the final part at
Stage3: Coronavirus live statistics free widgets.
Resources.
Dataflow Kit open COVID-19 Free API:
https://covid-19.dataflowkit.com/v1
https://covid-19.dataflowkit.com/v1/world
The full code is available in our public repository at https://github.com/slotix/COVID-19.git
Free Coronavirus (COVID-19) Widgets:
https://covid-19.dataflowkit.com/


Top comments (2)
Great work!
Thank you Nico!