Originally posted to Dashbird blog.
Since Facebook released its previously internally used query language GraphQL in 2016, it has seen an outstanding increase in adoptions for all kinds of applications. So it didn't come as a surprise when AWS built a managed solution called AppSync and released it in 2021. AppSync is becoming more and more popular and is already being used by large companies, including BMW and Sky.
AppSync for GraphQL
You may already be thinking that building and operating infrastructure for a GraphQL endpoint are tedious tasks, especially if it needs to be scalable for increasing or ever-changing workloads.
This is where AWS AppSync steps in by providing a fully managed service and a GraphQL interface to build your APIs. It's feature rich, as it allows you to easily connect resolvers to Lambda, OpenSearch, and Aurora or even directly attach DynamoDB tables via VTL templates.
Essentially, you'll get a managed microservice architecture that connects to and serves data from multiple sources with just a few clicks or lines of infrastructure code. AWS will manage your infrastructure, and you can focus on the implementation of resolvers.
Monitoring your endpoints
Sadly, the "managed" in "managed service" doesn't release you from all duties. There's no need to monitor infrastructure, as all infrastructure components are AWS's responsibility, but you still need to monitor your GraphQL endpoints to identify errors and performance bottlenecks.
AppSync integrates with CloudWatch natively and forwards a lot of metrics about your AppSync endpoints without the need for further configuration.
Metrics
The metrics reported by AppSync by CloudWatch are:
- Number of 4xx errors
- Number of 5xx errors
- Request latency -- how long it takes to fully process a request, including possible response template mappings
- Sample count statistics -- the number of API requests
If caching is enabled for your AppSync endpoint, the cache statistics include:
- Hits
- Misses
- Current items
- Evictions
- Reclaimed
This provides a good overview of how your API is doing, but no detailed view per resolver is possible because everything is aggregated. You can't tell which resolver is the issuer of an HTTP 500 error. Furthermore, there's no insight about any timings about the resolvers involved in a request. A query could be resolved via a lot of nested resolvers, which may result in high latencies for just a subset or a single slow resolver.
This is where logging comes in to help.
Logging
As previously mentioned, it's important to know all details about AppSync's processing steps for each request to gather insights about failing queries and other errors. Additionally, you require in-depth information about the performance of your GraphQL APIs and your resolvers.
This can be achieved by enabling logging for your APIs. AppSync allows you to configure this via multiple settings within the console, including:
- Enable Logs -- tells AppSync to start recording logs. It will generate execution and request summary logs that contain useful information we can use to monitor performance and errors.
- Include verbose content -- extends logs to include more details, including request and response headers, context, and evaluated mapping templates.
- Field resolver log level -- set this to Error or All to get further enhanced tracing logs that contain details about how long queries took to resolve per attribute.
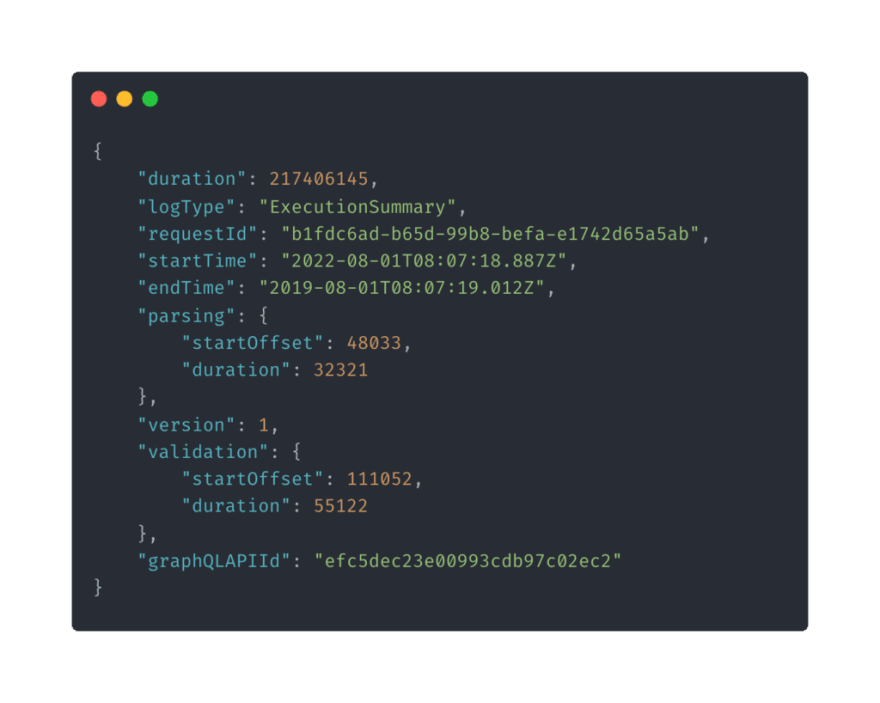
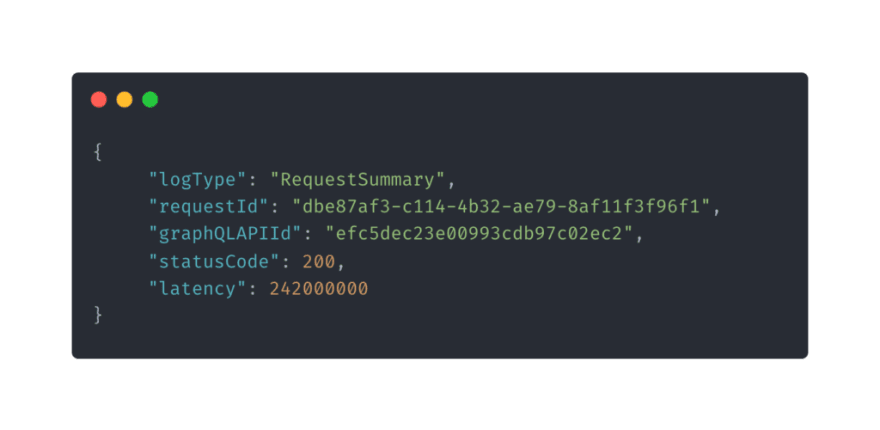
Even when verbose content is not enabled for your logs, the request and execution summary logs already show a lot of useful information.
This includes how long the parsing and validation steps took, as well as how long it took to complete the whole request.
With this configuration, we can now monitor the error rate, the errors themselves, and the latency of the top-level resolvers but nothing about nested resolvers. Field resolver log-level settings are required to get all the information to debug nested resolvers' performances. With this, we'll also get tracing messages per resolved attribute. This will enable us to analyze query performance in a very fine-grained manner, as we can see how long each resolver takes to collect the result of a field.
Additionally, we'll get RequestMapping and ResponseMapping logs for each (nested) resolver. By also enabling verbose content, these logs will be enhanced with the GraphQL request and both request and response headers, as well as the context object itself. This means that if we're investigating a DynamoDB resolver, we can see the mapping that was done by our VTL template and identify issues quickly.
💡 Important detail about having field resolvers' log-level settings set to All: the number of generated logs will not increase slightly but by an order of magnitude. For a frequently used AppSync endpoint, this will drastically increase costs due to the log ingestion as well as storage costs at CloudWatch. A great mitigation strategy to avoid exploding costs is to set proper log retention and have only small windows of detailed field resolver logs.
The latter can, for example, be achieved by using scheduled EventBridge rules and Lambda, which will switch between resolver log-level configurations of "Error" and "All" regularly. Depending on the schedule, you'll end up with only a fraction of the logs and, therefore, costs without losing insights into your AppSync endpoint.
Switching between field resolver log-level settings via Lambda
AWS X-Ray + AppSync
AppSync integrates with X-Ray, allowing you to get trace segment records and a corresponding timeline graph. This helps you visually identify bottlenecks and pinpoint their resolvers at fault.
Sadly, the subsegments only show rudimentary information about the request and response and don't provide further details that would help to debug problems. Everything is just collected under the AppSync endpoint. It can be filtered, but it's not flexible enough to cover the requirements necessary for GraphQL.
How to monitor AWS AppSync with Dashbird
As with many other services, you'll face the classic downsides: a lack of visibility, a lot of noise, and a clunky integration with CloudWatch alarms and logs.
Dashbird is here to help you get around these limitations so that you can focus more on building a great product instead of fighting with the AWS console. We have just added support for AppSync to help you monitor all of your AppSync endpoints without needing to browse dozens of logs or stumble through traces in the X-Ray UI.
There's no need to set up anything besides our CloudFormation template and the necessary permissions to ingest logs via CloudWatch and X-Ray. Dashbird will then automatically collect all needed information -- without any performance impact on your application -- and prepare it graphically.
At a single glance, you'll see fundamental information about the performance and error rate of your AppSync endpoint. Furthermore, all requests will be displayed with their status code, request latency, and flag if there were any resolver errors. By clicking on the request itself, you can drill down into it and look at the query and context.
This shows all the involved resolvers and how much they contributed to the overall response latency, which is crucial information for finding bottlenecks. There's also a list of any resolver issues. Clicking on a resolver issue will take you to the error overview, giving you more details about when this error first occurred and how many errors of this type have already appeared.
There's also out-of-the-box alerting via Slack, email, or SNS. Since Dashbird automatically clusters similar errors, noise will be reduced, and there's no need to configure anything in advance to receive critical information in your inbox or channel without flooding it and causing cognitive overload.
Also, metrics provided by AWS are enhanced to enable better filtering. For example, CloudWatch's requests metric will only give you the number of requests that *all APIs *have processed in a single region, but there's no way to know how many requests have been made to a single API or endpoint. With Dashbird, you can always pinpoint the number of requests per endpoint for any given period of time.
Future outlook
There's more to come at Dashbird, as we're already building more features to help you run the best possible AppSync endpoints. This includes a set of well-architected insights to guide you with best practices.
Key takeaways
Monitoring is fundamental to any web application. Even though AppSync offers a high level of abstraction of the underlying infrastructure, keeping your endpoint and its resolvers healthy and maintaining low latency is still your job.
CloudWatch and X-Ray offer tools that enable you to get the logs required to achieve detailed observability for your application relying on AWS's managed GraphQL solution. Dashbird takes this to the next level by offering you a structured overview of all your AppSync endpoints, which contain all the details you need to debug errors, resolve bottlenecks, and give your team more time for application development instead of stumbling through CloudWatch logs and X-Ray traces.
Get started with Dashbird for free today -- there's no credit card required, you'll receive 1,000,000 Lambda invocations for free, and the setup won't take longer than five minutes!


Top comments (0)