Hey dev community! 👋 Today I'm kicking off a hands-on tutorial series where we'll build a production-ready IoT analytics system from scratch. Together, we'll create a scalable infrastructure that can ingest, process, store, and visualize millions of sensor readings in near real-time.
Here, I'll introduce the key components of our IoT data pipeline architecture using Apache Kafka and TimescaleDB (PostgreSQL optimized for time-series data), and show you how this setup can ingest over 2.5 million sensor readings in just 31 minutes. 🤯
The IoT Data Challenge
If you've worked with IoT data before, you know it comes with unique challenges that traditional data systems struggle to handle:
High Volume: Millions of devices generating continuous data streams
High Velocity: Real-time data requiring immediate processing
Variety: Different data formats and structures from diverse sources
Reliability Requirements: Ensuring no data loss during transmission
Security Concerns: Protecting sensitive information
Integration Complexity: Connecting heterogeneous systems seamlessly
To address these challenges, we need a robust pipeline combining specialized tools.
Our Tech Stack: The Core Components
1. Apache Kafka: The Messaging Powerhouse
Apache Kafka is our distributed event streaming platform that handles large volumes of real-time data efficiently. Think of it as a sophisticated messaging system:
Producers: Our IoT devices that generate and send data
Topics: Categories like "sensor_readings" where related messages are stored
Consumers: Applications that read and process data from topics
Message Queue: Ensures reliable delivery and proper message ordering
Kafka excels at handling massive throughput while providing fault tolerance and scalability — essential qualities for IoT pipelines.
2. TimescaleDB: Time-Series Optimized Storage
TimescaleDB extends PostgreSQL with specialized capabilities for time-series data:
Time-Partitioning: Automatically chunks data by time intervals, dramatically improving query performance
Built-in Time Functions: Simplifies common time-series analysis
SQL Interface: Leverages the power and familiarity of PostgreSQL
Hypertables: Special tables that partition data across time and space dimensions
Compression: Reduces storage requirements by up to 90% or more
Continuous Aggregation: Pre-computes time-based aggregations for faster analytics
Data Retention Policies: Automates dropping or archiving older data
"While many organizations opt to manage sensor data using different databases, we've always favored PostgreSQL with extensions like Timescale. This transforms a relational database into a robust IoT database."
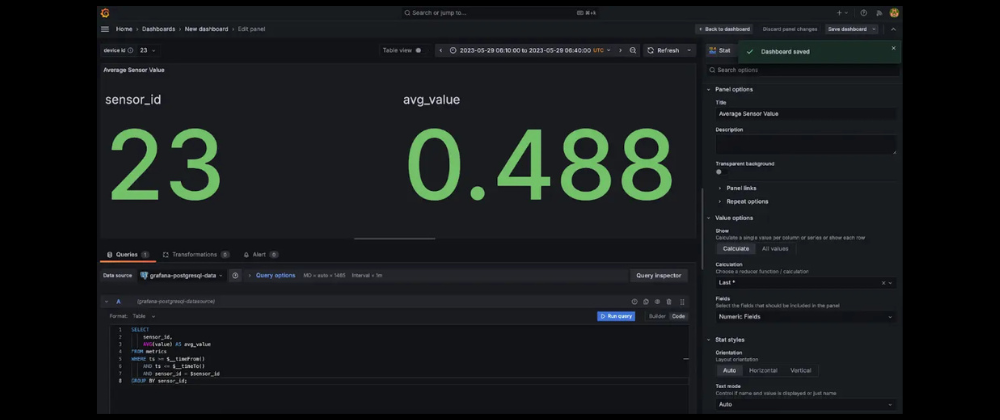
3. Grafana: Visualization and Monitoring
Grafana completes our pipeline by transforming raw data into actionable insights:
Interactive Dashboards: Custom views of real-time and historical data
Multi-Source Integration: Direct connection to TimescaleDB
Alerting System: Notifications based on thresholds and patterns
Time-Series Focus: Purpose-built for IoT data visualization
Hands-On Implementation: Connecting Kafka with TimescaleDB
Let's walk through setting up our pipeline. Here's an overview of what we'll accomplish:
- Set up Kafka
- Configure our TimescaleDB connection
- Prepare a sample dataset
- Stream data into our pipeline
- Measure performance
1. Setting Up Kafka
First, let's download and set up Apache Kafka:
sudo mkdir /usr/local/kafka
sudo chown -R $(whoami) /usr/local/kafka
wget https://downloads.apache.org/kafka/3.9.0/kafka_2.13-3.9.0.tgz && tar -xzf kafka_2.13-3.9.0.tgz -C /usr/local/kafka --strip-components=1
Start the Kafka environment (in different terminal windows):
# Start the ZooKeeper service
cd /usr/local/kafka
bin/zookeeper-server-start.sh config/zookeeper.properties

# Start the Kafka broker service
cd /usr/local/kafka
bin/kafka-server-start.sh config/server.properties
Create a topic for our sensor data:
cd /usr/local/kafka
bin/kafka-topics.sh --create --topic sensor_readings --bootstrap-server localhost:9092
2. Configuring TimescaleDB Connection
For this tutorial, we'll use TimescaleDB Cloud (free 30-day trial available) for convenience, but you can use the open-source extension with your PostgreSQL installation.
First, create a configuration file for Kafka Connect to interface with TimescaleDB. Let's call it timescale-sink.properties:
"camel.kamelet.postgresql-sink.query":"INSERT INTO metrics (ts, sensor_id, value) VALUES (CAST(:#ts AS TIMESTAMPTZ), :#sensor_id, :#value)",
"camel.kamelet.postgresql-sink.databaseName":"tsdb",
"camel.kamelet.postgresql-sink.password":"your_password",
"camel.kamelet.postgresql-sink.serverName":"service_id.project_id.tsdb.cloud.timescale.com",
"camel.kamelet.postgresql-sink.serverPort":"5432",
"camel.kamelet.postgresql-sink.username":"tsdbadmin"
This tells Kafka Connect how to map the data stream to our TimescaleDB table. The :# syntax indicates parameters populated from Kafka messages.
Create our metrics table in TimescaleDB:
-- Connect to your TimescaleDB instance
CREATE TABLE metrics (
  ts TIMESTAMPTZ NOT NULL,
  sensor_id INTEGER NOT NULL,
  value DOUBLE PRECISION NOT NULL
);

-- Convert to hypertable
SELECT create_hypertable('metrics', 'ts');
3. Preparing Our Dataset
For the tutorial, we'll use a sample dataset of sensor readings:
# Download sample data
wget https://assets.timescale.com/docs/downloads/metrics.csv.gz
gzip -d metrics.csv.gz


# Convert to JSON for Kafka ingestion
echo "[" > metrics.json
awk -F',' '{print "{\"ts\": \""$1"\", \"sensor_id\": "$2", \"value\": "$3"},"}' metrics.csv | sed '$ s/,$//' >> metrics.json
echo "]" >> metrics.json
4. Streaming Data to Kafka
With our data prepared, we'll use the kcat utility to stream it to our Kafka topic:
# Install kcat if you don't have it
sudo apt-get install -y kcat  # Debian/Ubuntu
# or
brew install kcat  # macOS with Homebrew

# Stream data to Kafka
cat metrics.json | jq -c '.[]' | kcat -P -b localhost:9092 -t sensor_readings
Start the Kafka Connect worker to move data from Kafka to TimescaleDB:
cd /usr/local/kafka
bin/connect-standalone.sh config/connect-standalone.properties timescale-sink.properties
Performance Analysis
During our test run, we tracked these metrics:
Total Records: 2,523,726 sensor readings
Kafka Streaming Duration: 18 seconds
Kafka Streaming Rate: ~140,207 rows/second
TimescaleDB Ingestion Duration: 30 minutes and 58 seconds
TimescaleDB Ingestion Rate: ~1,358 rows/second
Total Pipeline Latency: 1,858 seconds
These results demonstrate the pipeline's efficiency in handling substantial IoT data volumes. While Kafka easily handled high-throughput streaming, database write operations naturally took longer due to disk I/O and index maintenance.
What's Next?
With our pipeline successfully ingesting data, we've laid the groundwork for real-time analytics. In the next article, we'll explore:
- Building interactive Grafana dashboards
- Setting up real-time alerts
- Optimizing queries for time-series analysis
- Implementing data retention policies
Conclusion
By combining Kafka's streaming capabilities with TimescaleDB's optimized time-series storage, we've created a robust foundation for real-time IoT analytics.
This architecture handles the high volume, velocity, and variety of IoT data while providing the reliability and scalability needed for production environments. Whether you're monitoring industrial equipment, tracking health metrics, or analyzing environmental sensors, this pipeline approach offers an effective solution.
Resources to Get Started
Series Roadmap
This three-part series will cover:
1. Architecture Overview (This Article) — Understanding the key components
2. Implementation Tutorial — Step-by-step deployment of the full pipeline
3. Building Monitoring Dashboards — Creating Grafana visualizations
Have you built IoT data pipelines before? What challenges did you face? Let me know in the comments! 👇
Follow for the next installments in this IoT analytics series!


Top comments (0)