Debugging is an essential part of software development. It can be a time-consuming and frustrating process. There is nothing wrong with putting print statements inside the code to check something quickly. If it works for you in most cases, then why should you worry about overcomplicating this process? However, in more complex scenarios, using just a logging mechanism may be insufficient or even unfeasible.
This article covers the usage of Visual Studio Code debugging tools for Python applications. Examples are shown on the FastAPI app running on top of the uvicorn server. The article addresses the following scenarios:
- debugging a locally running code
- running a container and attaching a debugger to it
- attaching to a running container and debugging the code inside it
After reading this article, you will have a comprehensive understanding of the different debugging methods available in VSCode. This will enable you to choose the most appropriate strategy for any given scenario.
Prerequisites
The main focus of this article is the configuration and usage of the VSCode debugger. It doesn't focus too much on the uvicorn, FastAPI, or Docker specifics. Everything related to the debugged app can be found in the debug_hell project, which is available here: link. You can set it up by yourself, by cloning the repository and running the commands from the readme file. From a high-level perspective, debug_hell is a straightforward, create-read API that uses an ORM to store records in the database.
Problem Statement
In the modern programming world, most projects contain Docker configuration for quick and reliable local setup. Often you just need to prepare the environment variables and run two commands: docker compose build and docker compose up. This will result in building and running all the containers required for the app to be functional. This is also the case for debug_hell project, which consists of the FastAPI app and Postgres database.
Docker makes setting up apps locally a breeze, however, things get more complicated when it comes to debugging. Your code is now running in the container and it also uses its version of installed packages, not your local virtual environment. Placing breakpoints in your code or in external packages will simply not work.
Debugging App Locally
The first method for debugging an app, such as debug_hell, is to run the server locally, which means replacing the Docker container with a local process. This approach has a clear disadvantage: installing dependencies locally. Although it may seem counterproductive, it could be the easiest and quickest solution in certain simpler situations.
This is precisely the case for the debug_hell app, which requires only two dependencies: installed packages and the Postgres database. To set up the former, create a new virtual environment, by running the following commands:
python -m venv venvsource venv/bin/activatepip install requirements/dev.txt
When it comes to the database, the local process can also utilize the one from the Postgres Docker container. You can start it up just like before by executing the docker compose up command.
With that in place, the next step is configuring the debugger. Take a look at the configuration for the debug_hello app, located in the .vscode/launch.json file:
{
    "configurations": [
        {
            "name": "Run Server",
            "type": "python",
            "request": "launch",
            "module": "uvicorn",
            "args": [
                "debug_hell.app:app",
                "--reload",
                "--host",
                "0.0.0.0",
                "--port",
                "8001"
            ],
            "env": {
                "DATABASE_URL": "postgresql+asyncpg://postgres:postgres@localhost:5432/debug_hell"
            },
            "justMyCode": false
        }
    ]
}
Since the packages are available locally, the debugger can start its own uvicorn server. Besides the debugger-specific configuration, you can also notice two important changes:
- the port is set to 8001 to not interfere with the in-container app (if one is not stopped)
- database URL is pointing to the
localhostinstead of thepostgres, which was only accessible within the Docker network
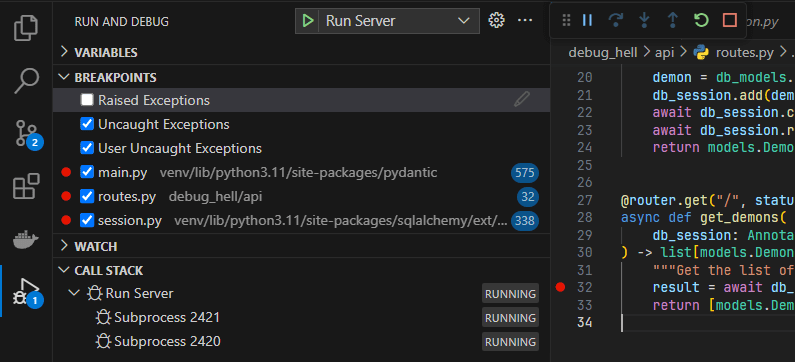
Now that you have everything set up, you can begin debugging. Navigate to the "Run and Debug" section and run the "Run Server" configuration or press the F5 key. A floating menu will appear for the debugger, allowing you to easily place bookmarks in your code and external libraries within the virtual environment. See the example result below:
From now on, when your request passes through the bookmarked code, the debugger will stop and grant you access to all the runtime insights. That includes both the "Variables" section in the debug tab and the debug console, which enables you to execute Python commands from the stopped line.
Implementing this approach is a fast and efficient way to produce the desired outcome. However, as previously mentioned, it may not always be that easy to set up apps locally. Docker is so popular because it simplifies the setup process. If there is a complicated installation process in place, avoiding Docker may be too time-consuming. The next section demonstrates how to utilize the debugger in conjunction with Docker containers.
Running Container Debugger
If the application you're dealing with has a more complicated setup, using Docker containers is likely the more logical choice. Luckily, the VSCode debugger offers built-in features to collaborate with Docker.
To get started, first specify the tasks in the .vscode/tasks.json file that will be executed to build and start the debugging container:
{
    "version": "2.0.0",
    "tasks": [
        {
            "type": "docker-build",
            "label": "docker-build",
            "platform": "python",
            "dockerBuild": {
                "dockerfile": "${workspaceFolder}/infra/Dockerfile",
                "context": "${workspaceFolder}",
                "target": "dev",
                "pull": true
            }
        },
        {
            "type": "docker-run",
            "label": "docker-run: debug",
            "dependsOn": [
                "docker-build"
            ],
            "dockerRun": {
                "ports": [
                    {
                        "containerPort": 8001,
                        "hostPort": 8001
                    }
                ],
                "volumes": [
                    {
                        "containerPath": "/code",
                        "localPath": "${workspaceFolder}"
                    }
                ],
                "network": "debug_hell_default"
            },
            "python": {
                "args": [
                    "debug_hell.app:app",
                    "--reload",
                    "--host",
                    "0.0.0.0",
                    "--port",
                    "8001"
                ],
                "module": "uvicorn"
            }
        }
    ]
}
If you have prior knowledge of Docker, this configuration should be comprehensible to you. In addition to some debugger-specific details and the port being modified, there is one more crucial adjustment: the Docker configuration now has the network attribute set to debug_hell_default to enable the container to access the database from the Docker Compose configuration.
Now that you have it set up, you can add the next launch configuration to the .vscode/launch.json file:
{
    "configurations": [
        {
            "name": "Run Docker",
            "type": "docker",
            "request": "launch",
            "preLaunchTask": "docker-run: debug",
            "python": {
                "pathMappings": [
                    {
                        "remoteRoot": "/code",
                        "localRoot": "${workspaceFolder}"
                    }
                ]
            }
        }
    ]
}
You should now be able to start the "Run Docker" configuration under the "Run and Debug" section with that basic config in place. Running it will cause the Docker image to be built and the container to be started. You should see the debugger menu again, and you can begin inserting breakpoints in the code.
This approach is quite flexible, does not require running anything locally, and already works fairly well. When it comes to debugging, in many cases it will be enough. However, one major drawback is that the code from external libraries cannot be debugged. Because the container runs its own version of Python, you simply cannot place bookmarks in the installed packages, because you don't have access to them.
The following chapter explores attaching to a running container in order to debug the code inside it.
Debugging App Inside Container
Debugging code from a running container is convenient, but it can be a little more challenging when dealing with third-party libraries. Luckily, there are tools available that enable working with VSCode inside the Docker container and debugging code within it.
There are several steps you must take to get ready for debugging within the container:
- Install the "Dev Containers" extension. It allows you to enter a Docker container and open a folder inside it, just like you would normally do with your project.
- Start the debugging container with the "Run Docker" configuration created in the previous section.
- Enter the running Docker container by doing the following:
- Press CTRL + Shift + P key combination.
- Select the "Dev Containers: Attach to Running Container…" option.
- Select the debugging container started in step 2.
- Open the
/codedirectory, if one is not opened already.
Now that it's set up, you'll be able to view all the code from the container's perspective. Any changes made to files within it will also be reflected in your local VSCode window.
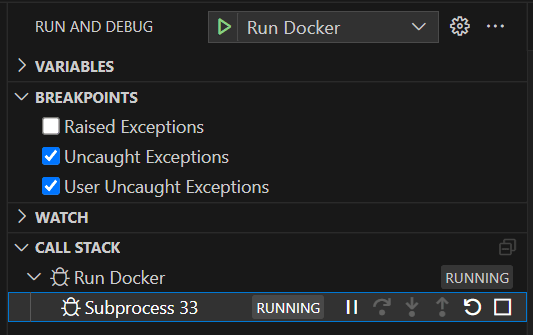
The Python process you want to debug is already running within the container as a result of step 2. You may connect a debugger to an already running process by supplying its id to the VSCode configuration. The Python process id may be found in the original VSCode window, under the "Call Stack" part of the "Run and Debug" tab. Here's an example of a process with id 33:
With that information, you may return to the in-container VSCode window. A few more steps are required to connect the debugger to the running process.
To begin, ensure that the Python extension in VSCode is installed. When you have it, you must also choose a proper virtual environment. It should be /usr/local/bin/python by default. That is where the Docker container stores its Python version along with all installed libraries.
Another dependency is the gdp package. Without it, you cannot run the debugger correctly. To install gdp library, simply run apt-get install gdp command.
Now that the required setup is complete, it's time to include a new configuration in the .vscode/launch.json file:
{
    "configurations": [
        {
            "name": "Attach",
            "type": "python",
            "request": "attach",
            "processId": "${command:pickProcess}",
            "justMyCode": false
        }
    ]
}
When started from the "Run and Debug" tab, that simple configuration will prompt you for the process id you obtained previously. The debugger should correctly attach to the running process after passing it. That configuration is eventually supposed to function exactly like the one from the first chapter. You should be able to place breakpoints in your code and external libraries, and the debugger should respect both.
Summary
Debugging Python applications or libraries can be a challenging task, but Visual Studio Code offers useful tools to help developers debug Python code effectively. While more advanced IDEs like PyCharm come with powerful debuggers, they often require additional costs, have steep learning curves, or consume more resources. In contrast, VSCode is a free and lightweight option, but configuring its debugger requires some extra effort. The three methods presented here offer good choices for different situations where a debugger is needed.
Sources
Source code for the debug_hell project can be found here: link.


Top comments (0)