Situation
To visualize http requests on grafana, I installed Nginx Ingress and Prometheus in Kubernetes Cluster (RKE2). The installation steps are based on official guide as follows.
https://kubernetes.github.io/ingress-nginx/
The similar problem is reported on GitHub.
https://github.com/kubernetes/ingress-nginx/issues/5755
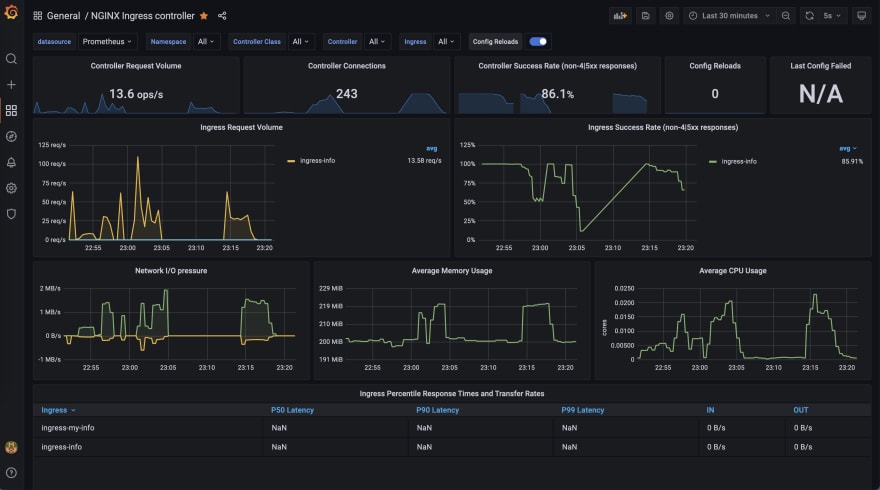
The figure shows this situation.
Cause
This problem is caused by not specifying the 'host' parameter in yaml for ingress controller.
The metrics server in nginx ingress only return a few metric about the default host * (generally virtual host). Thus, few metrics display on grafana.
Solution
When you create ingress resource, you set 'host' parameter in yaml. Then, you can check the metrics (such as nginx_ingress_controller_requests) in grafana.


Top comments (0)