In this blog post I want to share how to debug a GO Operator on your local machine on macOS. Adam de Leeuw and I verified it in different GO operator projects. Sometimes you find on Google information which uses the older Operator SDK. The following instructions worked for us in March 2022. 😉
The blog post is structured in four sections:
- Prerequisites
- Basics
- Configure Visual Studio Code to debug the operator
- Debug your GO operator
1. PREREQUISITES
You need to …
- … ensure you have the Operator SDK installed (that also installs GO when you use brew for the installation)
- … setup the Visual Studio Code extension for GO
- … install DELVE debugger for GO
- … setup the integration of the DELVE debugger for Visual Studio Code
- … run an example GO operator 😉
2. BASICS
Please keep in mind some essentially basics when you run your operator locally with the make command:
make install run
That make install run command does …
- … deploy the needed manifests (
yaml's) to the Kubernetes cluster you use and create the connection. - … it starts the local GO application with the file called
main.go(in the last step inside make file with the commandgo run ./main.go)
3. CONFIGURE VISUAL STUDIO CODE TO DEBUG THE OPERATOR
With that in mind we know how to debug.
- First, you to run the
make install runcommand to ensure you operator will find all needmanifestsconfigurations on your cluster. - Now you need to configure the DELVE GO debug in Visual Studio Code
.vscode/launch.jsonconfigurations file in your workspace.
STEP 1: CREATE A .VSCODE/LAUNCH.JSON FILE IN VISUAL STUDIO CODE WITH A GO CONFIGURATION
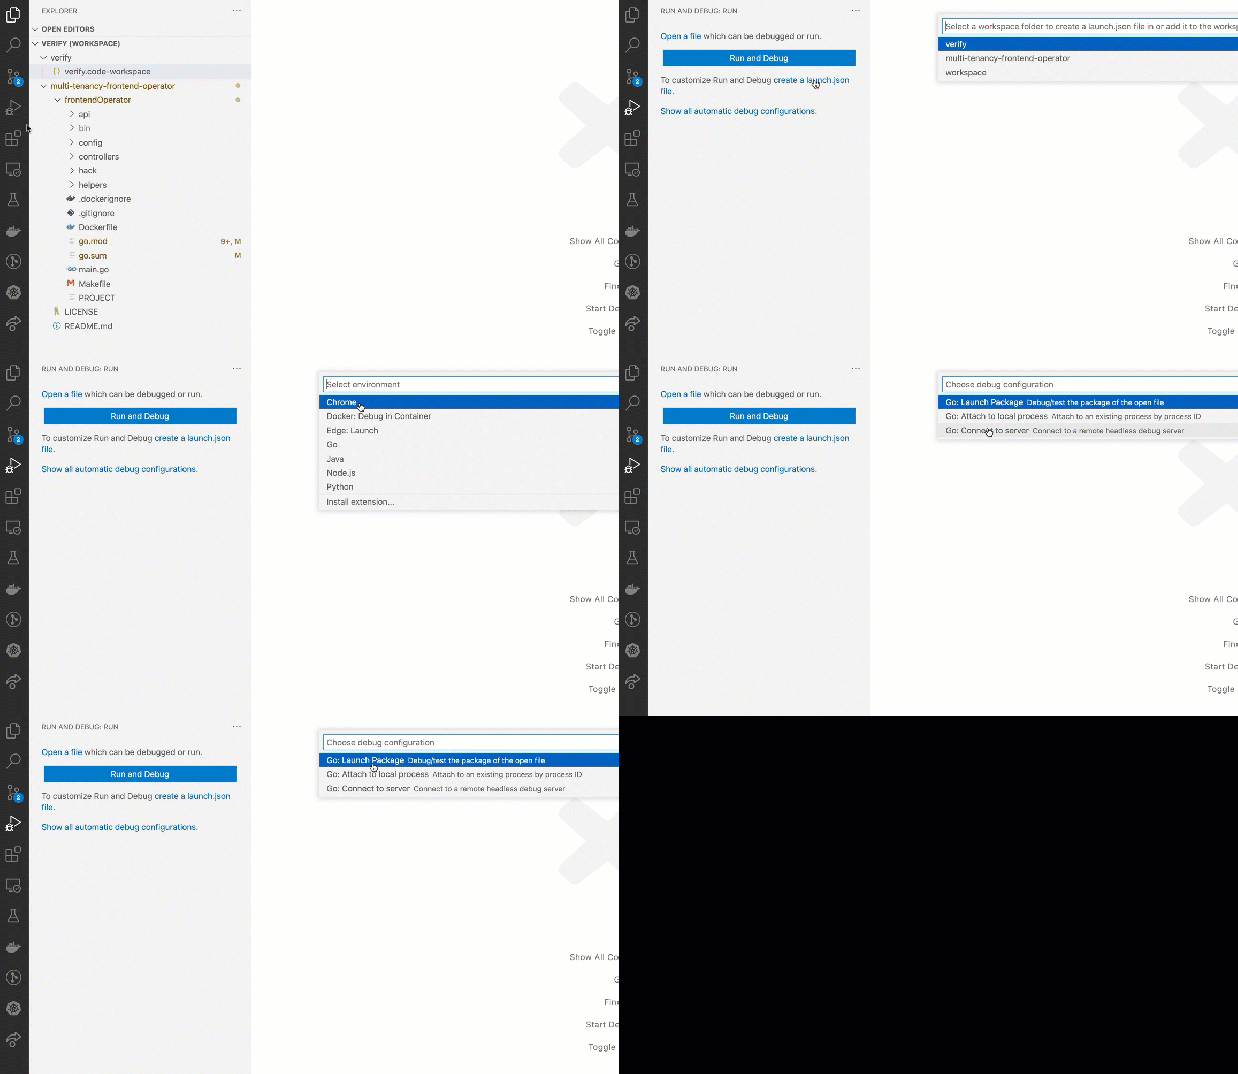
The following short gif shows the creation of a .vscode/launch.json file. In that case it uses the folder where my workspace file is located and you see that go package was used as debug a configuration.
That’s the example result you saw in the gif.
"configurations": [   {
  "name" :  "Launch Package" ,
  "type" :  "go" ,
  "request" :  "launch" ,
  "mode" :  "auto" ,
  "program" :  "${fileDirname}"
} ]
STEP 2: NOW YOU CAN OPTIONAL CONFIGURE THE LOCATION WHERE YOU WANT TO START THE MAIN.GO FILE.
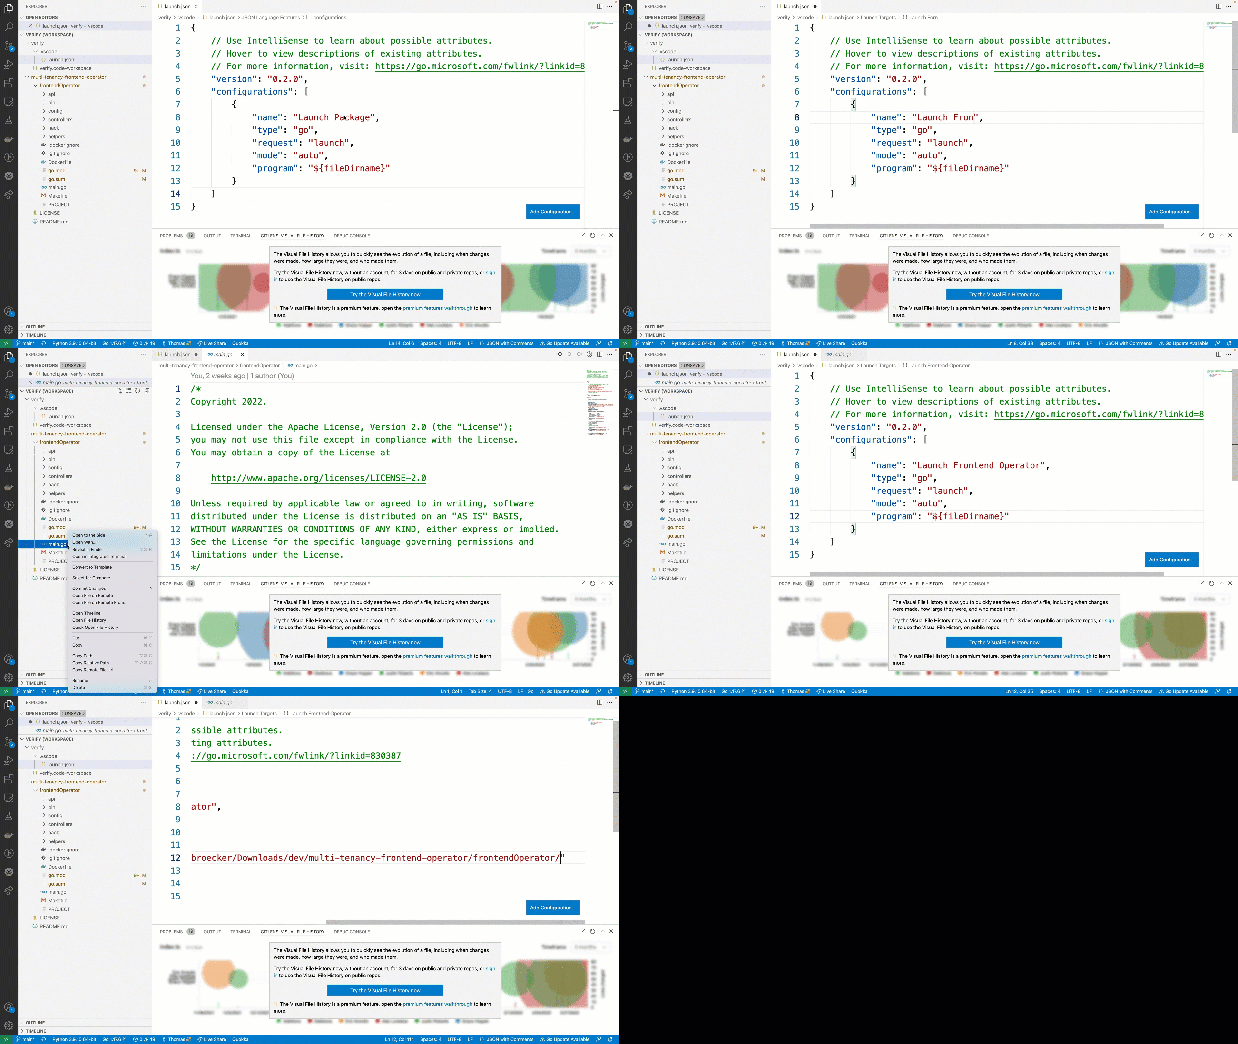
Just to ensure the right operator will be started. The gif below show how to customize the .vscode/launch.json file.
That’s the example result you saw in the gif.
{    // Use IntelliSense to learn about possible attributes.
     // Hover to view descriptions of existing attributes.
     // For more information, visit: https://go.microsoft.com/fwlink/?linkid=830387    "version" :  "0.2.0" ,    "configurations" : [
  {         "name" :  "Launch Frontend Operator" ,
                    "type" :  "go" ,
            "request" :  "launch" ,
            "mode" :  "auto" ,
             "program" :  "/Users/thomassuedbroecker/Downloads/dev/multi-tenancy-frontend-operator/frontendOperator"
} ] }
4. DEBUG YOUR GO OPERATOR
STEP 1: EXECUTE THE[ MAKE INSTALL RUN] FOR YOUR OPERATOR
You see the my example operator I used for my blog post and live stream Develop a simple operator to deploy a web application using the GO Operator SDK¶.
make install run
- Example output
/Users/thomassuedbroecker/Downloads/dev/multi-tenancy-frontend-operator/frontendOperator/bin/controller-gen
rbac:roleName=manager-role crd webhook paths= "./..."` `output:crd:artifacts:config=config /crd/bases /Users/thomassuedbroecker/Downloads/dev/multi-tenancy-frontend-operator/frontendOperator/bin/kustomize` `build config /crd | kubectl apply -f - customresourcedefinition.apiextensions.k8s.io /tenancyfrontends .multitenancy.example.net configured /Users/thomassuedbroecker/Downloads/dev/multi-tenancy-frontend-operator/frontendOperator/bin/controller-gen` `object:headerFile= "hack/boilerplate.go.txt"
paths= "./..." go  fmt` `./... go vet ./... go run . /main .go 1.6461312240985138e+09 INFO  controller-runtime.metrics   Metrics server is starting to listen   { "addr" :  ":8080" }
1.646131224098974e+09  INFO  setup  starting manager 1.646131224099315e+09  INFO  Starting server { "path" :  "/metrics" ,  "kind" :  "metrics" ,  "addr" :  "[::]:8080" }
1.646131224099315e+09  INFO  Starting server { "kind" :  "health probe" ,  "addr" :  "[::]:8081" }
1.6461312240993888e+09 INFO  controller.tenancyfrontend   Starting EventSource   { "reconciler group" :  "multitenancy.example.net" ,  "reconciler kind" :  "TenancyFrontend" ,  "source" :  "kind source: *v1alpha1.TenancyFrontend" }
1.6461312240994549e+09 INFO  controller.tenancyfrontend   Starting Controller    { "reconciler group" :  "multitenancy.example.net" ,  "reconciler kind" :  "TenancyFrontend" }
1.646131224200895e+09  INFO  controller.tenancyfrontend   Starting workers { "reconciler group" :  "multitenancy.example.net" ,  "reconciler kind" :  "TenancyFrontend" ,  "worker count" : 1}
STEP 2: STOP THE OPERATOR EXECUTION
STEP 3: ADD A BREAK POINT TO THE CONTROLLER AND START THE DEBUGGING FOR THE GO OPERATOR[¶]
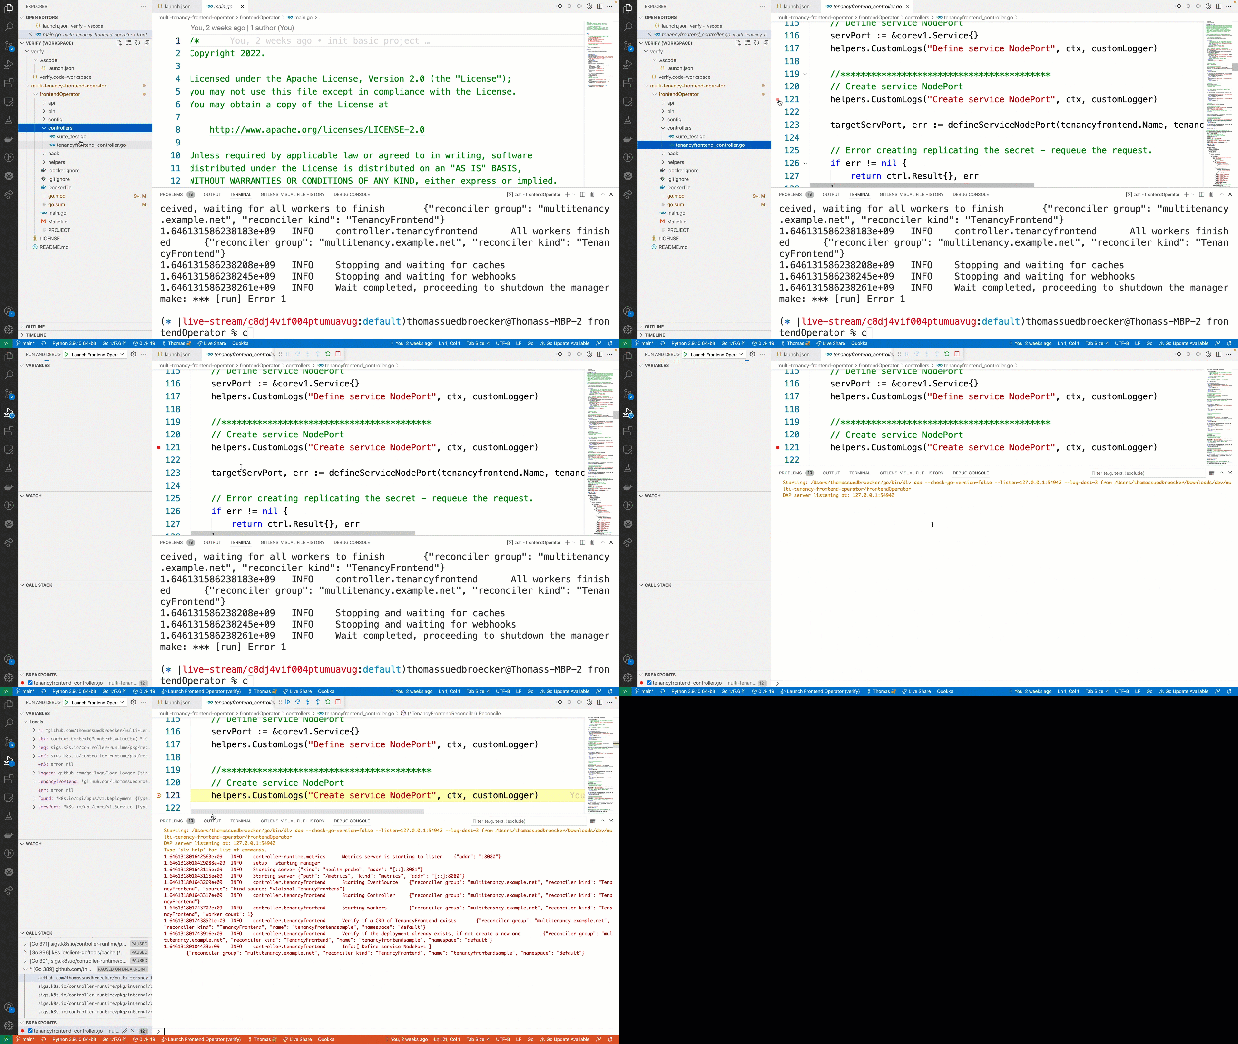
The gif below shows how create a break point and start the debugging. You need to take a look in the debug console.
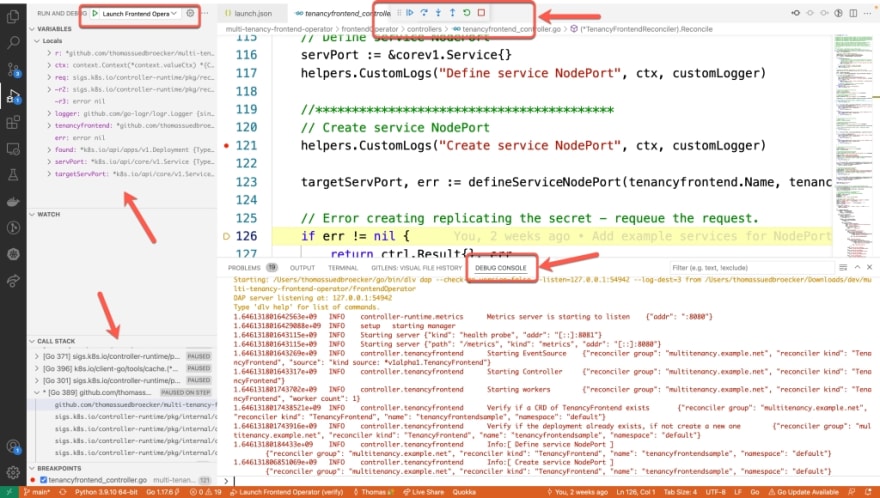
In the following image you see a screen shot of the running debugging.
Take a short look at
- Run and debug
- Start the debug session with the just defined GO configuration for the Operator
- Observe
- Variables
- Watch
- Stack
- Debug console
- Show the output we would see, when we would have started operator with a make command
SUMMARY
It’s awesome to use the powerful DELVE debugger for GO inside Visual Studio Code when you build a GO Operator. 🙂
I hope this was useful for you and let’s see what’s next?
Greetings,
Thomas
Source: www.suedbroecker.net


Top comments (0)