I took some notes while watching the excellent "Mastering Chrome Developer Tools v2" course from the FrontendMasters team. Hope you find them useful. Please leave your favorite tips and trick with comments below. 🤓
Debugging
Did you know that you could BlackBox some third party scripts while debugging through your code. That will hide those scripts from the call stack when you stop running with breakpoints.
Networking
Holding the Shift key and moving the mouse around you can see who (in red) loaded a file under the cursor and which files (in green) were loaded because of this file.
Waterfall
Queueing
- The request was postponed by the rendering engine because it is considered a lower priority than critical resources (like styles)
- The request was put on hold because the browser allows only 6 TCP connections per origin on HTTP 1
Stalled / Blocked
Time the request spent waiting before it could be sent. It could be because of Queueing. Additionally, this time could include time spent on proxy negotiation.
DNS Lookup
Every new domain on a page requires a full roundtrip to do the DNS lookup.
Waiting (TTFB)
Time To First Byte - request time to the server plus the time spent waiting for the server to deliver the response.
Content download
Time spent receiving the response data.
Capture Screenshots
This option will allow us to see how the page will render while it loads.
Filter
You can use multiple properties simultaneously by separating each property with a space. For example, mime-type:image/gif larger-than:1K displays all GIFs that are larger than one kilobyte. These multi-property filters are equivalent to AND operations. OR operations are currently not supported.
Read more on the docs.
Audit
webpagetest.org
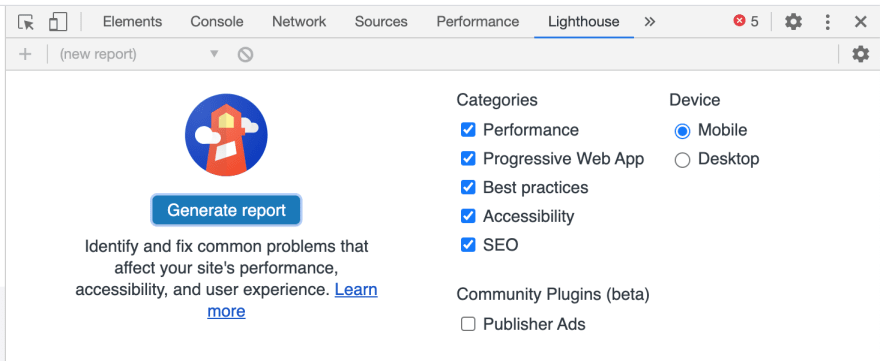
Lighthouse
webhint.io
Node.js Debugging
Use --inspect flag to run your server: node --inspect server/index.js
Performance
We will have the User Timing data section for all our Performance API calls.
Rendering
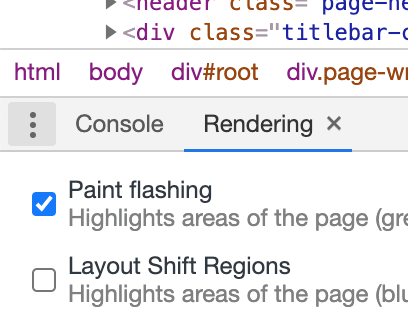
Go to the Rendering menu item of the Console menu.
Then turn on the Paint flashing option.
Then the browser will start highlight areas of the page that need to be repainted (in green).
Task Manager
Go to Chome menu -> More Tools -> Task Manager. There you can see all your tabs. Turn on the Javascript Memory column (with right-click on the columns). If you see that Javascript Memory constantly grows over time that could be a sign of a memory leak.
Credits
Mastering Chrome Developer Tools v2
Photo by Cesar Carlevarino Aragon on Unsplash


Top comments (1)
Really helpful article, learned some new things, thank you