Are you a developer who is concerned about the size of newly added libraries? Or do you want to find a culprit in a rather big Javascript bundle?
If you’re like me, then you answered yes to both questions.
In this post I’ll cover a few tools that come in handy for a quick analysis of bundle sizes without changing or ejecting your build architecture.
VS Code extension: Import Cost
Understand the cost of an import early.
This extension will display inline in the editor the size of the imported package. It supports tree shaking, so the size should be displayed correctly for a few exported functions.
With this you may spot mistakes like these:
import moment from 'moment'; // 289.7KB
moment.now();

import { now } from 'moment'; // 0.082KB
now();
It’s also available for JetBrains IDE, Atom and Vim.
👉 https://github.com/wix/import-cost
Website: Bundlephobia
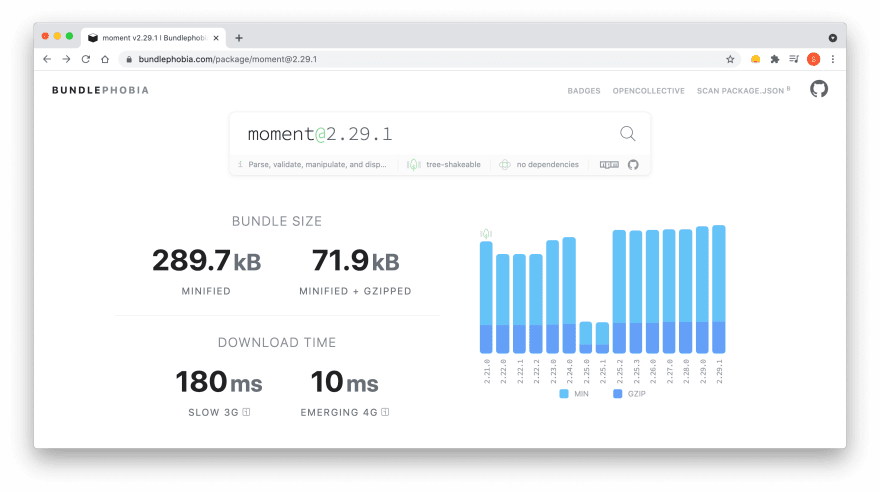
his website lets you search for libraries and display their sizes without the need to install. It shows the size of each version and even suggests alternatives to similar libraries that might be lighter—talking about a new framework or library every week.
You could also drop your package.json file and order it by size to see your biggest libraries. Personally I find this quite fun, but usually I use this tool to check bundle sizes of not-yet-installed libraries.
NPM: source-map-explorer
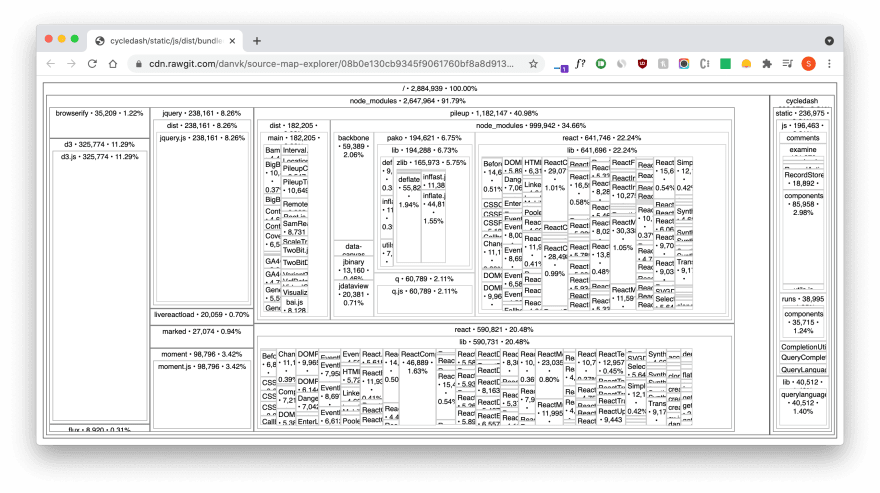
Like the name suggests you need to build source maps. With modern framework CLIs it’s enabled by default in prod builds.
Useful tool for imported package visualisation in relation to their size. By clicking on the packages, you can further imspect their sizes and children.
👉 npx source-map-explorer ./dist *.js
👉 https://github.com/danvk/source-map-explorer
Website: PageSpeed Insight / Lighthouse
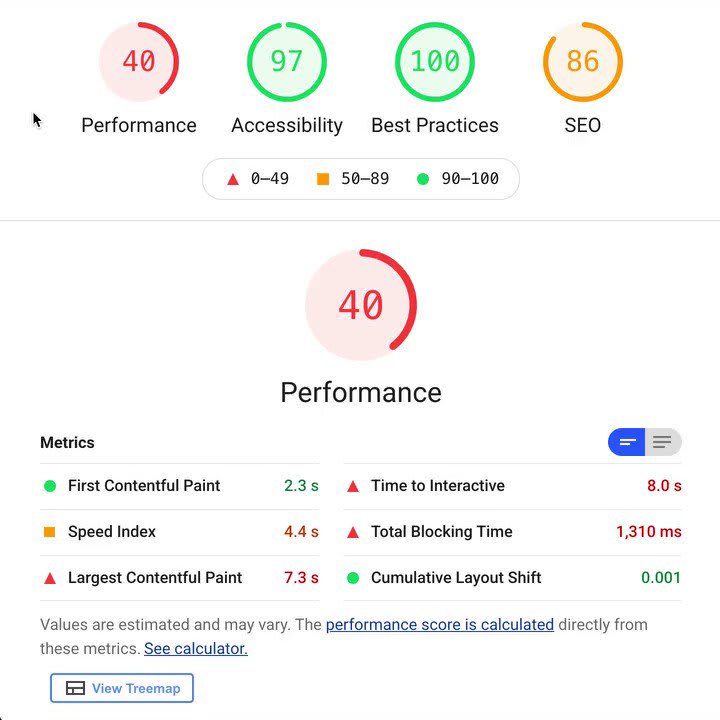
If your site is already public you can use Google’s PageSpeed Insight to detect big Javascript bundles.
Bonus: It also includes Javascript files, that are downloaded on runtime from your ad networks, Google Tag Manager and other tools.
👉 https://developers.google.com/speed/pagespeed/insights/
Check out this tweet to see the treemap in action:


 Lighthouse@____lighthouse
 The Lighthouse Treemap lets you see what's in the JavaScript you ship and find where you can trim based on module size and execution coverage.
With Lighthouse 8 it's now in PSI, Canary DevTools, and the CLI if it can see your source maps 🌳🗺️
Try it out: googlechrome.github.io/lighthouse/tre…19:08 PM - 03 Jun 2021
Simon Wicki is a Freelance Developer in Berlin. Worked on Web and Mobile apps at JustWatch. Fluent in Vue, Angular, React and Ionic. Passionate about Frontend, tech, web perf & non-fiction books.


Top comments (0)