When running and maintaining an application in a production environment, we want to feel confident about the behavior of the application and know when it isn't working as expected. At the least, we want to track errors, monitor performance, and collect specific metrics throughout the application.
Because we're developers and love maintainable solutions (right?), we also don't want to end up in a jumble of tools, integrations, and dependencies that make it harder for us to keep track of everything.
In this post, we will add AppSignal to a Ruby on Rails application to help give clear insights into application behavior.
Prerequisites if you want to follow along with the code:
- An account on www.appsignal.com
-
Docker installed and running (to use
docker-compose). *only required if using the sample application in this post
Setting up AppSignal
Note: You can skip this section if you're adding AppSignal to your own Rails application. In that case, you can also ignore the instructions related to Docker or how to restart your Rails server throughout the post — you instead restart/redeploy your application as you usually would.
We will use a sample application to get us started and run it on our machine using Docker.
Run the following commands to clone the repository, install dependencies, and run the application:
$ git clone --branch appsignal-setup/start-docker --single-branch https://github.com/choncou/sample_rails_app appsignal-setup
$ cd appsignal-setup
$ yarn start:compose
When you run this for the first time, it may take a while to build the docker images and download all the dependencies. Once it is complete, it will start the Rails server, PostgreSQL database, and Redis. You should see requests in the logs and view the running application on http://localhost:3000/.
About Our Sample Application
The application we're working with is very minimal, so there are only a few things to note.
We have a Post model, PostsController, and all CRUD actions exposed via the /posts route.
We also have a home page rendered by the PagesController, which enqueues a background job CreateRandomPostsJob to generate random posts asynchronously.
Lastly, we're using Sidekiq for background job processing.
Our small blogging platform also already has some active users. There is a script (./bin/traffic) running in the background together with the server that regularly makes a few requests to imitate traffic on the applications.
That's it. We've just released a product, and everything works perfectly...
Or at least that's what we think until we start seeing user reports about the application's performance and users running into errors.
So how do we figure out what's going on? When we're working in a development environment, it's easier to look into errors. But when our application is running in production, this becomes harder. There must be a better way to find errors than to search through those server logs.
AppSignal to the rescue!
Getting Started with AppSignal
Let's begin our monitoring journey by adding AppSignal to our application.
You'll need to log into your account at www.appsignal.com.
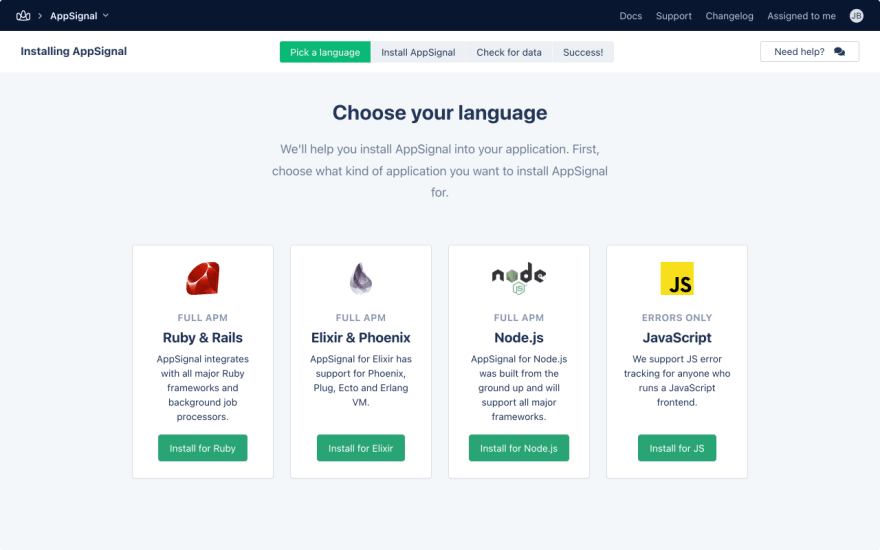
If you're a new AppSignal user, you will see the page below to add an application (whereas existing users need to click on 'Add app').
Select "Install for Ruby", which will then give us a few simple steps to follow:
-
Add the gem to your
Gemfile
# Gemfile gem 'appsignal' -
Install the gem by running
bundle installinside of the docker container, which you can access withyarn compose:sh
$ yarn compose:sh # We are now in a bash console within a docker container $ bundle install # Stay in this console for the next command -
Install AppSignal
During the installation, you'll need to respond to two prompts:
- `Do you want to change how this is displayed in AppSignal? (y/n): n`
- `How do you want to configure AppSignal?` : Input `1` because we will use a config file instead of just environment variables

Use the API key shown on the AppSignal setup page:
```bash
$ bundle exec appsignal install <your-api-key>
...
...
#####################################
## AppSignal installation complete ##
#####################################

  Sending example data to AppSignal...
  Example data sent!
  It may take about a minute for the data to appear on https://appsignal.com/accounts

  Please return to your browser and follow the instructions.
```
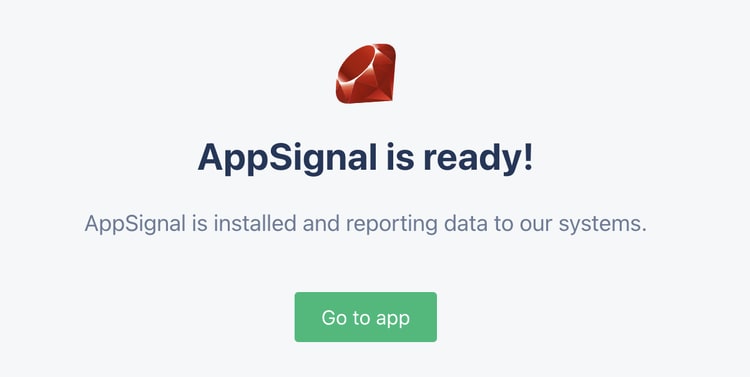
After you run the install script, you'll notice when the AppSignal setup is complete in your browser. You can then 'Go to app' to view your AppSignal dashboard for your development environment:
The installation command creates a config/appsignal.yml which allows you to configure AppSignal settings for different environments. You can learn more in the AppSignal Ruby configuration docs.
In the config/appsignal.yml is your push API key. You would usually remove it from this file and use an environment variable instead. For this post, that won't be necessary.
We need to restart the application to ensure that our changes take effect because we have installed a new gem. The simplest way is to stop the docker containers with ctrl-c inside of the terminal window running the server and start docker-compose again with:
$ yarn start:compose
This can take a while because it rebuilds the docker image when the dependencies change.
AppSignal Main Dashboard
Now that we have the application running with AppSignal installed, we can view the dashboard. To view all the applications and environments you have running on AppSignal, you can go to appsignal.com/accounts:
Click on the application name, and you can explore what AppSignal monitors out-of-the-box.
Within a few minutes, some data will already be collected because of your traffic generation script.
From the main dashboard, you can get a good high-level overview of a few essential application metrics. We're now going to dig into some of the more specific areas within AppSignal.
Errors Dashboard in AppSignal
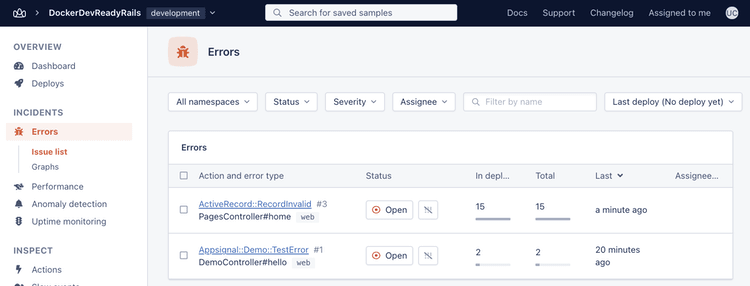
On the errors page, you find a list of all errors reported
by your application. When we ran the install script, a test error was sent to AppSignal. You can see that we also have an error that seems to be occurring pretty regularly. Clicking on the error will open up a page with more details, which can be useful to debug the issue.
In this case, we can see from the backtrace section that on the homepage of the application (/) there is a validation error occurring on app/controllers/pages_controller.rb:7 home.
Other AppSignal Dashboards
Under 'Dashboard' in the sidebar, you can see that AppSignal has provided us with a few different dashboards already.
The 'Overview' dashboard is available for every application and provides:
- Your application error rate
- Throughput
- Response times
- Other recent activity that you can dig into for more details
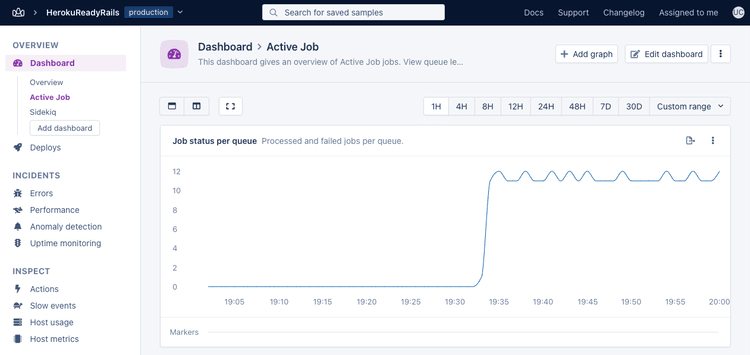
You also have two magic dashboards — one for Active Job and another for Sidekiq. AppSignal has built-in integrations for many popular frameworks and gems that work automatically with your Rails application.
When viewing these dashboards, you can see information relevant to the activity of that integration. In the Active Job dashboard, you'll see graphs for the number of jobs in each queue, the recorded duration of each job, and more. Give it a look!
Performance of Your App
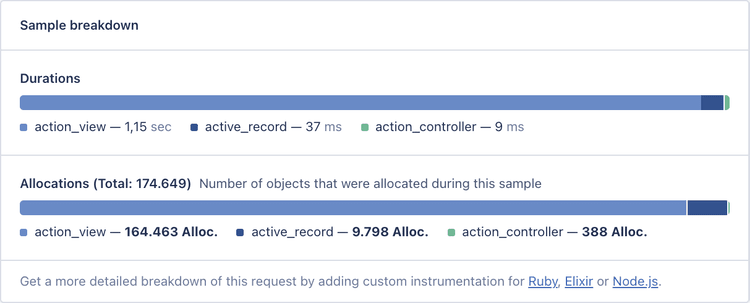
Inside of Performance → Issue list, you can view a list of actions that AppSignal measures. These measurements can provide some valuable insights into what parts of your application consume a lot of performance.
For example, by clicking into the issue for the action PostsController#index, we can dive deeper into the controller's performance. You can quickly see a breakdown of where the most time is spent, or the most object allocations happen.
Quick Wins and Hidden Gems from AppSignal: Using Puma
There are a few hidden gems (not the Ruby kind) that you can get from AppSignal without much effort. Let's see how easily we can get these up and running with an example.
Inside of config/puma.rb, add the following line:
# config/puma.rb
plugin :appsignal
Before we restart the application, add the following environment variable after line 12 in the docker-compose.yml:
# docker-compose.yml
APP_REVISION: "latest_version_tag"
Because we've updated the Puma server config and our docker-compose config, we will need to restart the docker containers with ctrl-c and start-up docker-compose again with yarn start:compose.
Tracking Your New Insights
After the server restarts, allow it to run for about a minute, then head back to the AppSignal dashboard and refresh the page. There are two main areas with new information now:
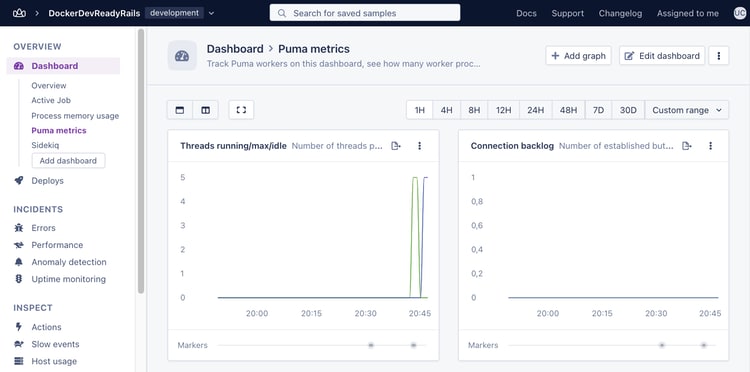
The first is the new automatically generated Puma metrics magic dashboard. Because of AppSignal's built-in integration with Puma, we now have information about the application server's activity. Specifying the plugin in the config file has activated a minutely probe that reports metrics about the Puma server.
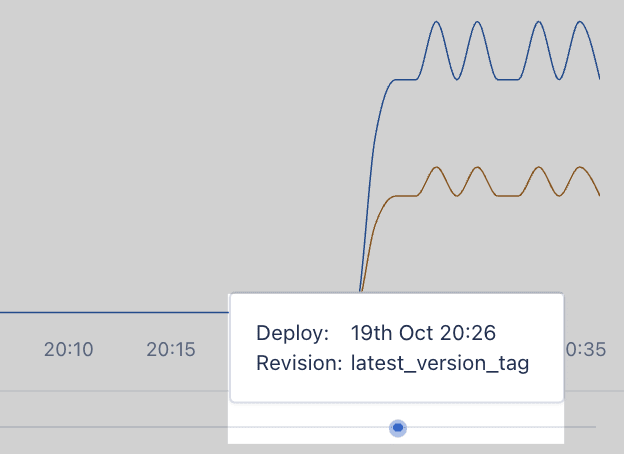
Lastly, across the entire AppSignal dashboard, there are now deployment markers. You can set the APP_REVISION environment variable to any value that helps you determine the current version of your application, such as a git commit SHA.
You can also see a history of your deployments by viewing the 'Deploys' section in the AppSignal dashboard and filter insights (such as Errors/Performance issue lists) by deploy. View how performance or reliability has changed between deploys, making it a bit easier to dig into which changes could have introduced a new bug.
Next Up: Custom Instrumentation and Monitoring for Ruby Apps
This post has shown how you can set up and use AppSignal in your applications to help increase your code's visibility in the wild.
We've demonstrated how AppSignal automatically integrates into Rails and some of the application's dependencies, such as Sidekiq and Puma. AppSignal works with many more Ruby frameworks and gems out-of-the-box. You can find a complete list of AppSignal's Ruby integrations here.
Part 2 of this series will cover how to add custom instrumentation and monitoring to your Ruby on Rails application for deeper insights.
Until next time!
P.S. If you'd like to read Ruby Magic posts as soon as they get off the press, subscribe to our Ruby Magic newsletter and never miss a single post!
Unathi Chonco is a Full-Stack Engineer at WeTransfer and Ruby on Rails contributor. He enjoys working across the Rails stack and sharing what he learns when solving day-to-day engineering challenges. You can find more content from Unathi on his blog or reach out via Twitter.





Top comments (0)