
This is a slightly modified version of the blog post I used to launch my sketchnotes.dev site. I've been sketchnoting for years and wanted a place to collect and share those visuals, but also share my journey (and resources) to help others take their first step into visual storytellling.
Hello and welcome to the world of visual storytelling for technical audiences.
About Me
My name is Nitya Narasimhan. I am a PhD in Computer Engineering, a creative technologist with 25+ years of experience in software & systems research and development, an engaged parent with a curious 11yo, and a polyglot who taught herself the relevant programming languages and platforms required for a multitude of projects in mobile, web, cloud and AI.
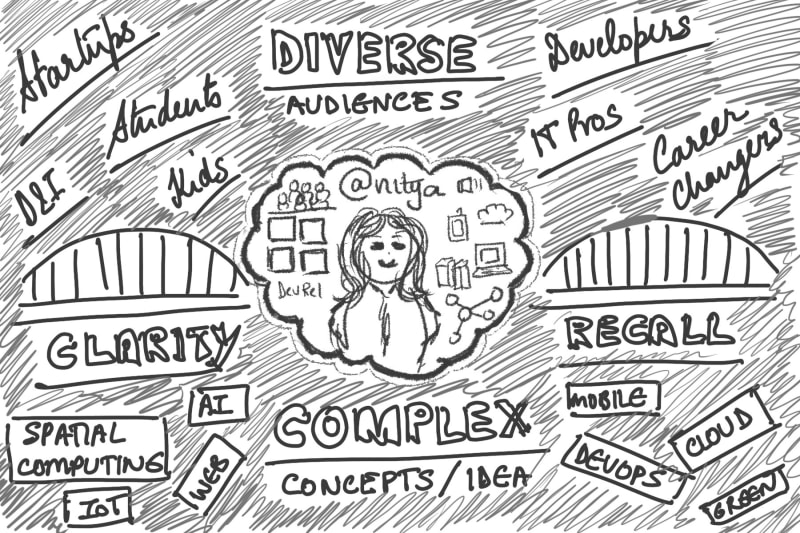
I'm the Developer Relations Regional PM for North America (US/Canada) at Microsoft. I build and execute programs that empower and support our developer and IT audiences across student, startup and professional contexts. I am data-driven and technology-agnostic. And I am passionate about communicating ideas to diverse audiences in relatable ways (so they have clarity of understanding) that easy to recall (and can translate awareness into actionable learning).
Here's a sketch that tells you a little about me.
About Visual Storytelling
This is why I began this journey into exploring ideas for visual storytelling. Here are some observations and facts that I learned recently.
- According to this Aug 1, 2017 article - there are many kinds of learning. Visual learners need pictures, graphs and visual cues to help them synthesize information. auditory learners need to hear the information in order to process it. And kinesthetic leaners need to perform an activity in order to grasp the concept. For the technology ecosystem this means there is value to visual notes and storytelling, audio podcasts and video tutorials, and hands-on workshops -- each of which can resonate with different subsets of the audience.
- And according to this Visual Teaching article, 65% of the population are visual learners (as of 1998) - with increasing access to audio-visual content platforms and tools, this percentage is likely higher. By contrast only 10% were auditory learners. Other facts they share - the brain processes visual information 60,000 times faster than text and visual aids improve learning by 400 percent and can improve subsequent recall (e.g., with 90% accuracy shown after 72 hours for 2500 pictures that were looked at for just 10 seconds).
When we think about technology development, it is well known that the starting point for everything lies in the technical documentation. This could be the formal "docs" provided by the product team, or the various talks, tutorials and workshops created by community and industry experts that show applied learning of those concepts. How could visual storytelling impact the clarity, consistency and recall of technical documentation?
Join me on this blog as I explore all the facets of visual storytelling through the lens of learn by doing. We'll explore ideas for sketching, infographics, iconography, typography, calligraphy and whimsy. And we'll amplify interesting and inspiring creative technologists who are blazing new trails in helping visual learners and makers worldwide skill up on their creativity.
And if you see this within the next 2 hours, I will be doing a 30-minute Spotlight Series on Sketchnoting 101 that can get you started. It's free and online - so join us! I'll post a link to the video here later.
Then practice! Try out three simple targets to practice first steps!
Let's go #SketchTheDocs


Top comments (0)