library(tidyverse)
library(pokedex)
ggplot is the ‘default’ plotting
library in R. It’s a very old package now, but has been kept up-to-date
and is one of the core ‘tidyverse’ packages.
rvest is also a tidyverse package that
deals with web scrapping, inspired by equivalents like “beautiful
soup”.
There is a table of hex colour codes used by
Bulbapedia
for each pokemon type. I’d like top be able to use this for plots made
with my pokedex package.
Webscraping with rvest
Get the data
read_html("https://bulbapedia.bulbagarden.net/wiki/Category:Type_color_templates") %>%
  html_nodes(".wikitable") %>%
  .[[1]] %>%
  html_table() -> pokemon_colour_table
This very simple pipe goes to the url and detects all html nodes with a
class of "wikitable" and puts them in a list. It then takes the first
element (of one in this case), converts it into a table, and assigns it
to a variable pokemon_colour_table
Clean the data
pokemon_colour_table %>%
  janitor::clean_names() %>%
  slice(1:75) %>%
  select(-video_game_types_3) %>%
  rename(type_full = video_game_types, colour = video_game_types_2) %>%
  filter(type_full != "") %>%
  mutate(
    type = tolower(str_trim(str_remove_all(type_full, "color|light|dark|\\:"))),
    colour_var = case_when(
      str_detect(type_full, "light") ~ "light",
      str_detect(type_full, "dark") ~ "dark"
    )
  ) %>%
  mutate(colour = paste0("#", colour)) %>%
  select(-type_full, type, colour_var, colour) -> type_colours
Cleaning the data is the more irritating part, as always. First,
janitor::clean_names() does a bunch of sane default things to make
sure our table names are snakecase, with no mad characters and
duplication etc.. Then, as we only want the first part we slice it, and
as we only want the first 2 columns, we drop the third. We then give the
remaining columns sane names, and remove rows that have empty strings.
The meat of the data cleaning comes next, parsing the label column to
get just the type out and convert it to lower case and putting it into a
new column, then conditionally checking if the row is a variant
light/dark hue, or the default, and making a column to represent that.
Finally we convert the colour code to an actual hex string.
Format for ggplot2 colour scale
ggplot2 wants the scale as a named list. Making this in a tidy way is
very straightforward.
type_colours %>%
  filter(is.na(colour_var)) %>%
  select(-colour_var) %>%
  mutate(colour = set_names(colour, type)) %>%
  pull(colour) -> pokemon_type_scale_colours
In this particular case we select all the values that do not have a
colour_var value, i.e. the defaults, drop the colour_var column, and
set the names of the colour column to the value of the type column.
We have to do this because scale_*_manual() in ggplot will expect a
named list, where the names are the type categorical variable, and the
contents of the list are the hex colour codes for that type. Then when
we pull that column into a list we will have a named list.
Theming
Add a font with showtext
Keeping the video game flavour, lets also make a quick theme using the a
video game font. We can use
showtext to easily add the
“Press Start 2P” font from google fonts.
library("showtext")
font_add_google("Press Start 2P")
showtext_auto()
Then, starting from the theme_minimal we can replace the default font,
and rotate the text labels on the bottom axis.
theme_pokedex <- function () {
  theme_minimal() %+replace%
    theme(
      text = element_text(family = "Press Start 2P"),
      axis.text.x = element_text(angle = -90)
    )
}

theme_set(theme_pokedex())
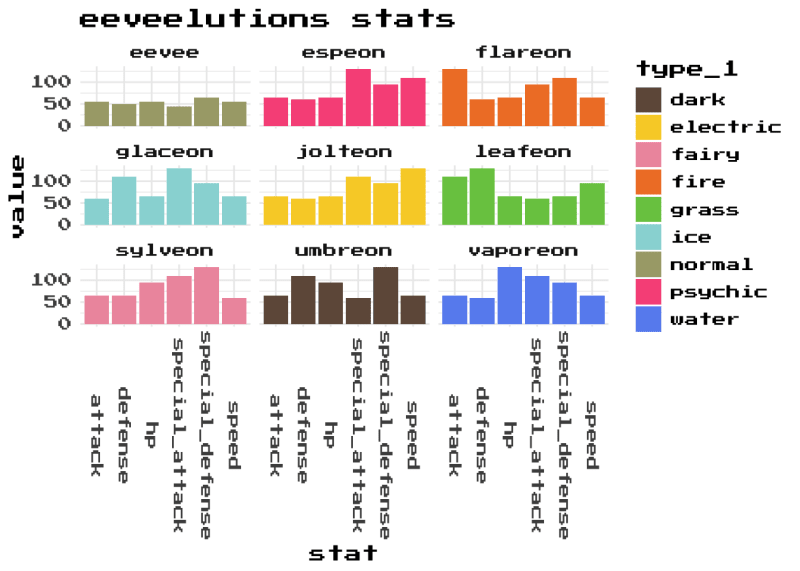
Eeveelutions
To demonstrate, lets make a simple plot showing the key stats of the
eeveelutions.
pokemon %>%
  filter(evolution_chain_id == 67) %>%
  select(identifier, hp:speed, type_1) %>%
  pivot_longer(cols = c(hp:speed),
               names_to = "stat") %>%
  ggplot(aes(x = stat, y = value, fill = type_1)) +
  geom_col() +
  facet_wrap(. ~ identifier) +
  scale_fill_manual(values = pokemon_type_scale_colours) +
  labs(title = "eeveelutions stats")


Top comments (0)