In this article, we will introduce the process of building a data app with a spreadsheet backend using Evidence. We will also explore the use cases where Evidence is particularly well-suited.
In the previous article, we introduced multiple methods for building a data app with a spreadsheet backend. This time, we will focus on one of the code-based frameworks mentioned earlier, Evidence, providing a detailed introduction and step-by-step guide.
Here is the previous article:https://dev.to/morph-data/how-to-build-an-internal-data-application-using-google-sheets-as-a-data-source-ddo
What is Evidence?
Evidence is an open-source framework primarily built on SvelteKit, a JavaScript framework. It requires a Node.js environment to operate.
One of the key features of Evidence is that it allows users to build dashboard-like data applications using SQL and Markdown syntax. Unlike traditional BI tools, which require complex GUI operations, Evidence enables users to create and manage interactive dashboards entirely in a code-based manner.
Step-by-Step Guide
Google Cloud / Google Sheets Configuration
1. Enable the Google Sheets API
Log in to the Google Developers Console, create a new project, and enable the Google Sheets API.
2. Generate a Service Account and Download the JSON Key
Go to APIs & Services > Credentials and create a new service account. Under the Keys tab of the service account, create a new key and download it in JSON format.
3. Grant Access to the Service Account on the Target Spreadsheet
Click the Share button on the Google Spreadsheet and add the service account. This allows the service account to access the spreadsheet data.
Setting Up and Configuring Evidence
1.Install the Evidence framework and start the development server.
npx degit evidence-dev/template project-name
cd project-name
npm install
npm run sources
npm run dev
2.Install the Google Sheets plugin by running:
npm install @evidence-dev/connector-gsheets
3.After installation, add the following to the end of evidence.config.yaml:
"@evidence-dev/connector-gsheets": { }
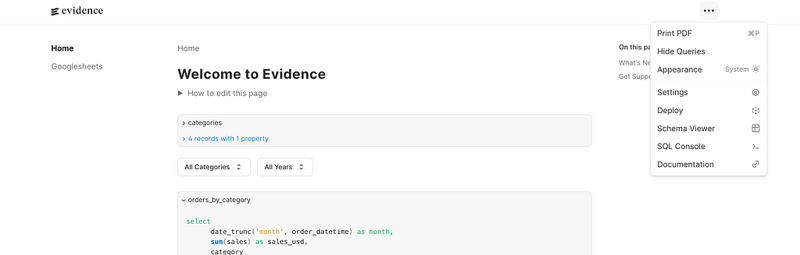
4.Run npm run dev to launch the Evidence page in the browser. Click on the "..." at the top and navigate to the Settings page.
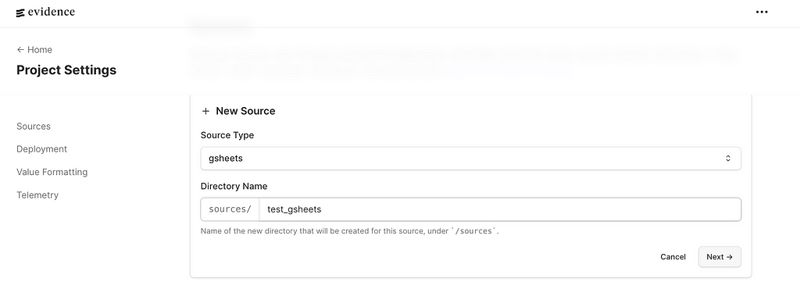
5.Click +New Sources. Select gsheets as the Source Type, enter a directory name, and click Next.
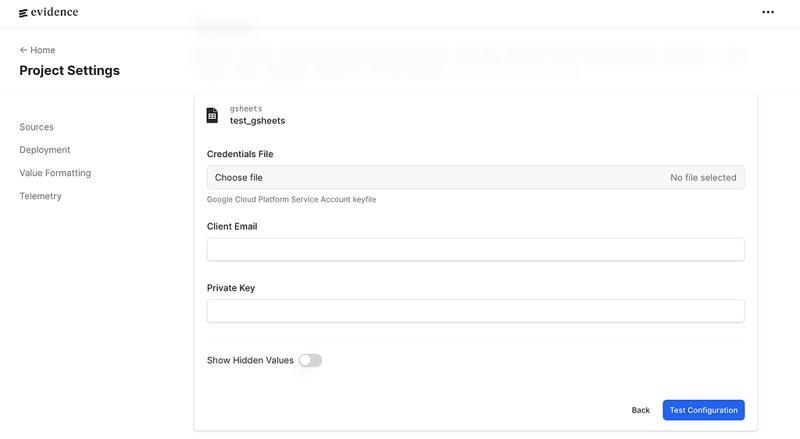
6.Upload the JSON file obtained in step 2 of the Google Cloud / Google Sheets Configuration section by clicking Choose file. Once the upload is complete, click Test Configuration to verify the connection. If there are no issues, click Save to store the connection settings.
7.Once the connection settings are saved, two files, connection.options.yml and connection.yml, will be generated in the directory created in step 5. Modify connection.yml as follows:
- your_workbook_name: The name of the Google Spreadsheet file
- your_sheet_id: The Google Spreadsheet ID (the string after https://docs.google.com/spreadsheets/d/ in the URL)
name: [your_source_name]
type: gsheets
options: {}
sheets:
[your_workbook_name]: [your_sheet_id]
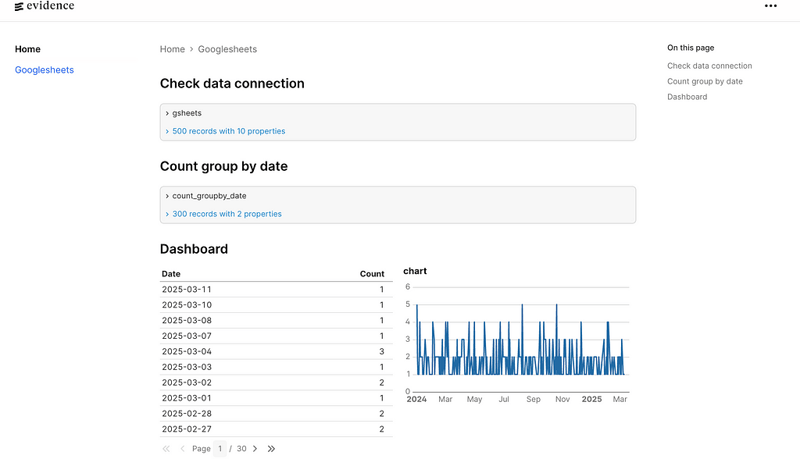
8.Create a new file named spreadsheet.md under the pages directory to build the app.
## Check data connection
``sql gsheets
select * from googlesheets.test_test
``

## Count group by date
``sql count_groupby_date
select "Created Date" as date ,
        count(*) as count
from googlesheets.test_test
     group by "Created Date"
     order by "Created Date" DESC
``

## Dashboard
<Grid cols=2>
    <DataTable data={count_groupby_date}/>

    <LineChart
        data = {count_groupby_date}
        y = count
        title = 'chart'
    />
</Grid>
9.Open the developed app in your browser to verify that everything is working correctly.
Summary
Evidence is ideal for data teams that primarily work with SQL and need to build data apps for analysis and reporting tasks.
Use cases where Evidence excels include KPI tracking, sharing business metrics (such as financial reports, sales performance dashboards, and marketing analytics reports), and creating regularly updated dashboards managed by data analyst teams.
Traditionally, data aggregation (using SQL) and visualization (using GUI-based BI tools or Python) were separate processes. However, with Evidence, dashboards can be created and managed entirely with SQL, making it a powerful tool for the right use cases.
We encourage you to give it a try!

Top comments (0)