So you're new to Observability and OpenTelemetry and Lightstep and you want to send traces to Lightstep to get a feel for the flow of things. But you're not sure how to get started. There's a LOT to learn and take in, and things can get pretty overwhelming, pretty fast, amirite? I feel ya. I've been there before. That was me last year. Solidarity!!
But, not to worry, my friend, because I am here to walk you through things. If you're looking to do a quickie setup to learn how to send OpenTelemetry data over to Lightstep, then you, my friend, have come to the right place!
The OpenTelemetry Demo repo was created to help lower the barrier to entry into OpenTelemetry and to illustrate its awesomeness. It features a fully-functioning online store made up of multiple micro-services, written in different languages that are supported by OpenTelemetry, that can send traces to an Observability back end, like Lightstep. (OMG that was a mouthful!) Most importantly, I found it superly duperly easy to set up and get going!
In today's tutorial, I will show you how to get Traces produced by the OpenTelemetry Demo into Lightstep. The example uses the OpenTelemetry (OTel) Collector to ingest the Traces and send them to an Observability back-end, which in our case, will be Lightstep.
A few important notes:
- I am assuming that you have a basic understanding of OpenTelemetry and Observability. If not, check out this great OpenTelemetry overview and Observability oberview.
- I will not be covering application instrumentation with OpenTelemetry - our goal is merely to get Trace data into Lightstep via the OTel Collactor.
Before we start the tutorial, let's do a quick OTel Collector overview, so that you can understand how you're getting data into Lightstep!
OTel Collector 101
The OpenTelemetry (OTel) Collector is a vendor-neutral service that ingests, transforms, and exports data to one or more Observability back-ends.
The OTel Collector consists of 3 main components:
- Receivers ingest data. Example data sources include: Kubernetes clusters, Prometheus, and application code.
- Processors transform data. This can include adding/removing data, modifying data (e.g. data masking), and even filtering data.
- Exporters send data to an Observability back-end. In our case, Lightstep. Lightstep ingests OTel data natively, using the OpenTelemetry Protocol (OTLP).
Pipelines are used to define how data flows in and out of the OTel Collector.
For more on the OTel Collector, please see the official OTel docs site.
NOTE: Although your instrumented code could technically send data directly to an Observability back-end (e.g. Lightstep) without a Collector, it's not really the right way to go about it. You should always funnel all OTel data (regardless of the soure) to your back-end by way of the OTel Collector.
Running the OTel Collector
There are several ways to deploy the OTel Collector; however, we're keeping things simple and local today, using Docker Compose, which runs Docker.
Configuration
The OTel Collector is configured via YAML.
The YAML file is used to define receivers, processors, exporters, and pipelines.
Tutorial
Ah, now the moment y'all have been waiting for - the tutorial! Let's do this!
For this tutorial, we will be using a modified version of the OpenTelemetry Demo repo. This repo has been modified to demonstrate how to send data to Lightstep using the OTel Collector. While the upstream repo contains configs to send data to a local installation of Jaeger, the modified version contains configs to send data to Lightstep. We will be keeping the Lightstep repo in sync with the upstream repo.
Pre-Requisites
Running the Demo App Locally
1- Clone the repo
git clone https://github.com/lightstep/opentelemetry-demo.git
2- Edit the OTel Collector Config file
This file allows you to configure the OpenTelemetry Collector with your own Observability back-end. This case, otelcol-config-extras.yml is already configured to use Lightstep as the back-end. All you need to do is add your Lightstep Access Token to the file, to be able to send traces to Lightstep.
cd opentelemetry-demo
Open src/otelcollector/otelcol-config-extras.yml for editing using your favourite editor. The file looks like this:
# extra settings to be merged into OpenTelemetry Collector configuration
# do not delete this file
exporters:
  logging:
    logLevel: debug
  otlp/ls:
    endpoint: "ingest.lightstep.com:443"
    headers:
      "lightstep-access-token": <lightstep_access_token>

service:
   pipelines:
     traces:
       receivers: [otlp]
       processors: [batch]
       exporters: [logging, otlp/ls]
     metrics:
       receivers: [otlp]
       processors: [batch]
       exporters: [prometheus, logging, otlp/ls]
Replace <lightstep_access_token> with your own Lightstep Access Token, and save the file. The Access Token tells what Lightstep project to send your telemetry data to.
A few noteworthy items:
- Lightstep ingests data in native OpenTelemetry Protocol (OTLP) format, so we will use the OTLP Exporter. The exporter can be called either
otlpor follow the naming formatotlp/<something>. We could call itotlp/bobif we wanted to. We're calling our exporterotlp/lsto signal to us that we are using the OTLP exporter to send the data to Lightstep. - Though not mandatory, we are also using a Logging Exporter. This is helpful, as it prints our traces to the Collector's
stdout. As you might imagine, this is great for debugging, especially if you see traces sent tostdout, but not to your back-end. - We must define a pipeline in the
service.pipelinessection of the YAML config. Specifically, we need to define a pipeline for our taces. The pipeline tells the Collector:- Where it's getting Trace data from (it's being sent via OTLP)
- If there's any processing that needs to be done (this is optional)
- Where to send data to. In our case, it's to
stdout(via the Logging Exporter) and to Lightstep (via OTLP Exporter)
- The Collector can ingest data using both HTTP and gRPC. The
receiversconfiguration may appear to be empty; however, it actually means that we are using the defult values for thereceiversconfig. It is actually the same as saying:
receivers:
   otlp:
     protocols:
       grpc:
         endpoint: 0.0.0.0:4317
       http:
         endpoint: 0.0.0.0:4318
TIP: If you find that you can't see data in Lightstep, make sure that you've defined a pipeline, and that the pipeline's exporter lists your
otlp/lsexporter. I can tell you that twice this week I forgot to add my exporter to the pipeline, and was sitting in front of my computer in sheer panic trying to figure out why I could see my traces instdoutbut not in Lightstep. 😱
3- Launch the sample app
If you're not already in the repo root, make sure you go there:
cd opentelemetry-demo
Run Docker compose. If you’re on an x86-64 machine (i.e. Intel or AMD-based, non-Apple Silicon), run the command below. If you’re running the Demo App for the first time, it will download all of the Docker images first. This may take several minutes.
docker compose up --no-build
If you’re on an Apple Silicon machine, you will need to build all images from source using the command below, as the images hosted in the GitHub Container Registry (GHCR) are built and optimized for x86-64 machines. This can take upwards of 20 minutes.
docker compose build
docker compose up
Once the app is up and running, you will see text continuously scrolling down the screen. This is expected!! The sample output looks something like this:
ASIDE: After the app started up, I kept waiting for the scrolling text to stop, only to realize that, "Oh, this thing is running. Guess I can access the URL now!" 🙄
Since we added our Logging Exporter to our pipeline definition, you'll also see that zoom by past you in the terminal:
NOTE: Obviously the Logging Exporter is more useful when it's not running with a bunch of other services competing for your attention on your terminal. This will be more useful if you're running it in Kubernetes or Nomad, or running standalone with Docker.
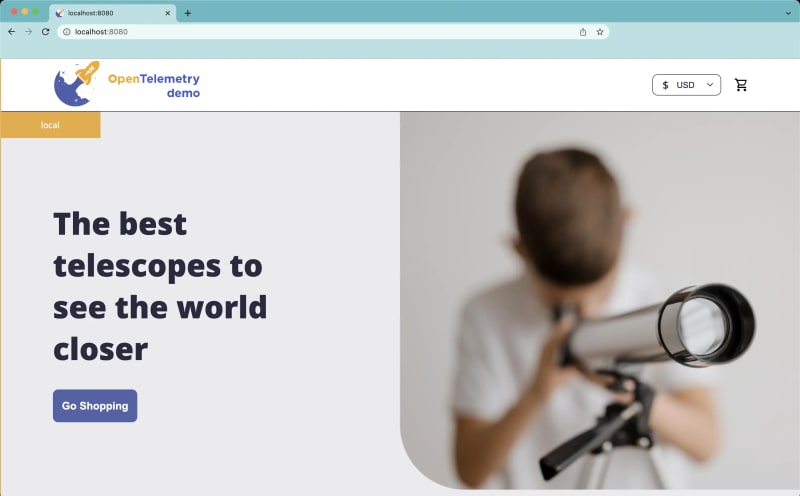
You can now access the Demo app: http://localhost:8080
Be sure to play around. Browse. Add items to your cart. Remove items from your cart. Checkout.
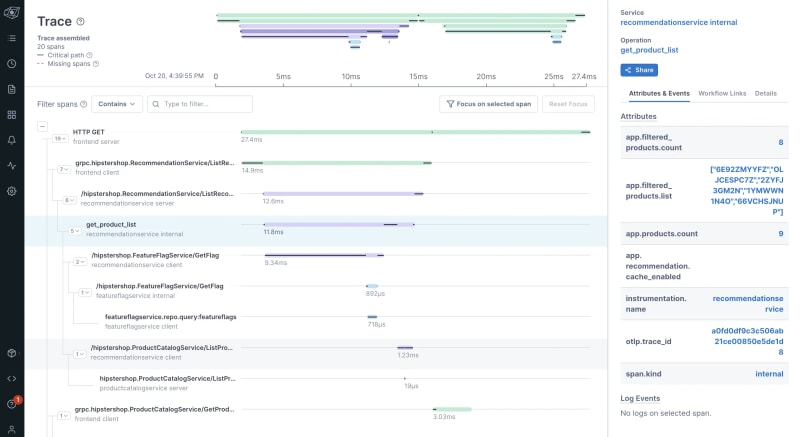
4- See the Traces in Lightstep
To view traces in your Lightstep Observability project, check out Lightstep Observability Notebooks.
And that's it! Didn't I tell you? Pretty straightforward!
Conclusion
Today we saw how easy it was to get Trace data into Lightstep using the modified version of the OpenTelemetry Demo Webstore, which uses our good friend, the OTel Collector.
Now that you've been able to get Trace data into Lightstep, I encourage you to play around with it. If you have any questions about Observability or OTel, pop into the Lightstep Community Discord, or get in touch by e-mail.
And to reward you for your work today, please enjoy this cartoon drawn by my daughter.
Peace, love, and code. 🦄 🌈 💫
The OpenTelemetry Demo Webstore App is always looking for feedback and contributors. Please consider joining the OTel Community to help make OpenTelemetry AWESOME!


Top comments (0)