Scenario: Developer Onboarding
Let's suppose I just inherited a new set of services. I'm new to the team, am familiar with the tech stack, but have never worked directly with the services my team is responsible for.
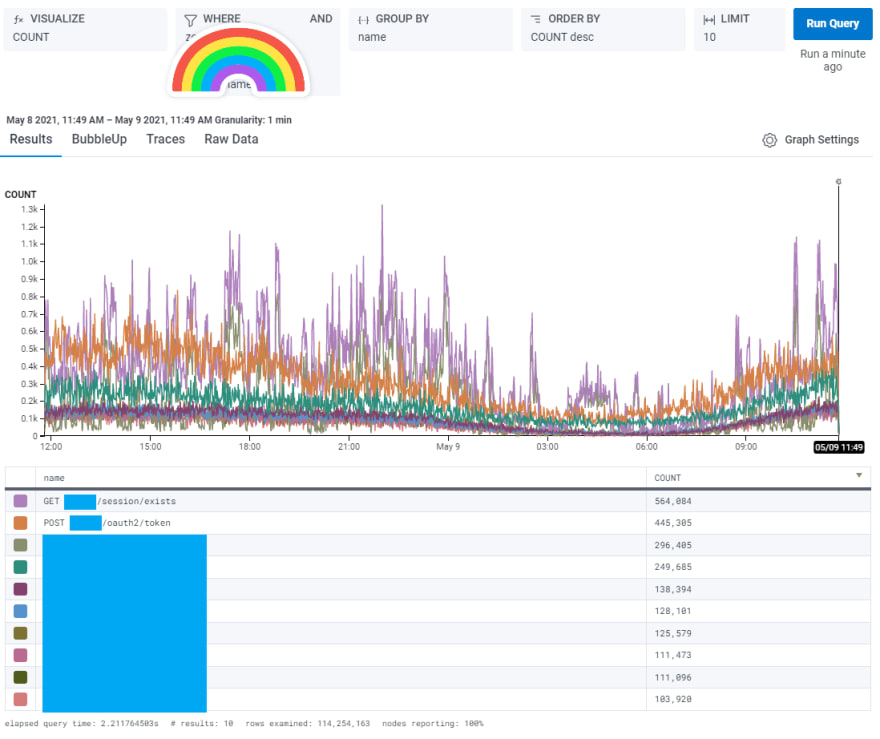
I would like to become acquainted with our services, what they do, and how we interact with other services on our platform. I load up Honeycomb, and with a quick query, I can get a list of the top 10 API calls our services have seen in the past 24 hours:
Huh -- seems like the /session/exists and /oauth2/token endpoints are the most-used. Using other information from that event, such as the service name and method name, I can easily pull up our codebase and find the entry point of that controller function. If I pull up a specific trace for one of those API calls, I can follow along in our code as it makes calls to internal and external integrations, and follow the exact path through code that request took.
This is usually the first thing I do when becoming familiar with a new system. Follow the common requests in code. Interpret what is happening. This will help build familiarity with the current state of the system, and contribute to a deeper understanding of the major paths through the service very quickly.
Don't stop there! Treat your systems as the living, breathing, ever-changing, increasingly-complex entities they are!
Spend 30-60 minutes of each morning browsing the service's events.
Can you identify the slowest average requests? How do releases have an effect on the event data such as request duration? How does traffic this week compare to traffic last week? How about differences between releases? What other services on our platform does this one interact with most?
Becoming intimately familiar with your system's state can help you identify areas for improvement and gives you a baseline to evaluate change against as you push feature releases and fixes to your deployment pipeline.
Struggling with where to start? Honeycomb offers a neat feature that allows you to browse queries your colleagues have run recently. Click through a few and tweak them to target a service and operation you are interested in. I have found this feature extremely helpful in getting started with query structuring and learning about the query operators and visualizations in Honeycomb. You can also link the query directly to the colleague who wrote it in a DM and ask for additional clarification / context.
One of the easiest contributions you can make early on after joining a new team and doing the investigation above is to add trace/span operations and tags of context information that may be useful when looking at traces or interrogating observability data. Ask someone familiar with your observability tooling for an example of adding a trace operation / span tag to your service code. Work from that example to add tags and trace operation context of your own.
For example:
Performing a memory cache operation? If there was an issue in the request, it might be useful to know whether or not an entity was read from the cache - add a cache_hit tag and set its value to true or false accordingly. While we're doing that, we might as well emit other info about the cache we have available to us, such as its current size. Now, every trace operation that retrieves the target entity will include a cache operation event that lets you know whether or not the entity was retrieved from the cache as well as the number of entities stored in the cache at the time of the operation.
Browsing your events and system traces in Honeycomb can bring about answers to questions you may not even have thought to ask. Events for your service coming from 10 different ip addresses? Looks like your service may run on 10 instances in production -- perhaps a distributed/shared cache would be more helpful than a local memory one.
Arbitrarily-wide events are cheap. Throw as much context data in there as you have available to you. It may prove useful to you or others later on.


Top comments (0)