Software at Scale
 Software at Scale
The Rise in Intelligent Observability
There will inevitably be an increasing number of bugs in modern software applications that appear only in production. The software stack is getting more complex (hello, Kubernetes), and there’s a growing trend for companies to “buy vs. build” - outsource all non-core functionality to SaaS tools outside of their control. Integration code between web applications is inherently harder to debug via local development, which might partially explain the rise in integration aggregators like Finch to reduce development cost per integration. Additionally, infrastructural components like Kafka are also getting completely outsourced to SaaS providers like Confluent, where developers will have limited ways to replicate problems without testing or staging environments. Finally, traditional production-only issues like performance regressions continue to exist and will only increase as the rate of software adoption increases.
Investors and incumbents in the observability space are aware of this trend, and there’s a flurry of new startups, investments, acquisitions, and consolidation in the last few months.

What’s Observability?
Honeycomb’s co-founder popularized the term in the software industry, and their definition is: “Observability in software is the ability to understand and explain any state a system can get into, no matter how novel or bizarre, without deploying new code.”
Observability is closely related to “debuggability” - the ability to understand where your software went wrong. As a post on the Google Testing Blog elegantly puts it - software needs to be designed to be debuggable. Small additions like high signal logging in the right places can help make the system more debuggable or observable.
 a.image2.image-link.image2-451-1040 {
padding-bottom: 43.36538461538461%;
padding-bottom: min(43.36538461538461%, 451px);
width: 100%;
height: 0;
}
a.image2.image-link.image2-451-1040 img {
max-width: 1040px;
max-height: 451px;
}
a.image2.image-link.image2-451-1040 {
padding-bottom: 43.36538461538461%;
padding-bottom: min(43.36538461538461%, 451px);
width: 100%;
height: 0;
}
a.image2.image-link.image2-451-1040 img {
max-width: 1040px;
max-height: 451px;
}
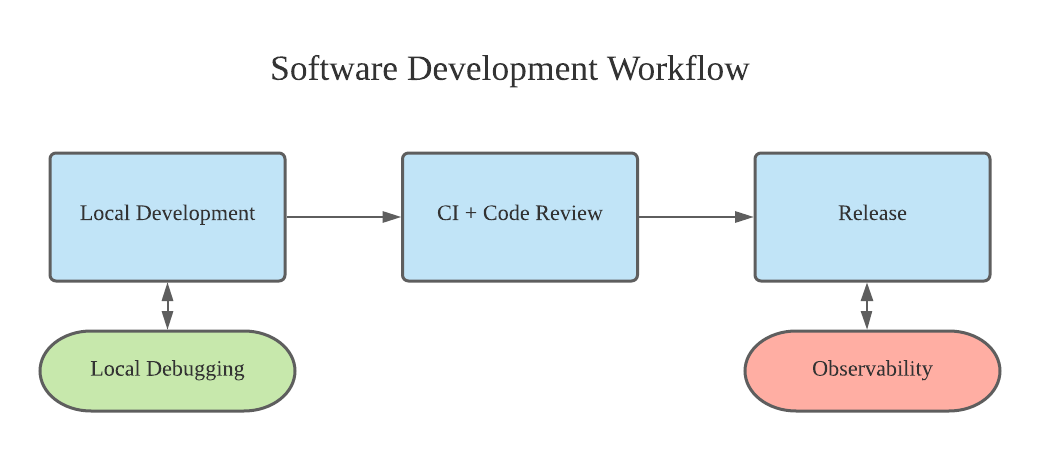
Trends in Observability
Debugging production issues is challenging for many reasons. The debugging experience is traditionally read-only - developers read logs and metrics to infer issues and submit code changes to add more monitoring or attempt to resolve an issue, and it’s impossible to “temporarily add a print statement for debugging” or use an interactive debugger1. Debugging information is also not generally automatically analyzed today - data is generally shown raw to developers, with options mostly to filter, slice, and visualize, and it’s often tricky to find the root cause of a specific problem.
Recently, I’ve interviewed the co-founders of a few DevOps monitoring, exception tracking, and observability startups like Sentry, Honeycomb, Lightstep, and Rookout on my podcast. Overall, it seems like observability tooling is getting more intelligent, interactive, and collaborative.
Interactive Debugging
One advantage of local development is that developers can easily tweak code, inspect variable values, and print to see if a certain code path is executed. Wouldn’t it be nice if a developer could add a breakpoint in production where they could inspect variable values (and not stop code execution) and see how often a code path is called on the fly? Rookout aims to do exactly that, and their demo sandbox makes you wonder why it isn’t common practice to use such a tool. These can be integrated with your monitoring or exception tracking tool to automatically jump to a line of code from an exception stack trace.
Another example of this is PixieLabs, a Kubernetes observability startup that got acquired before their application went out of beta and within a few months of their launch. Pixie uses dynamic eBPF probes, a new way to run sandboxed code in the Linux kernel, to automatically get logs and traces without needing to write any custom code.
In general, debugging, even in production, no longer needs to be read-only. Language and framework-specific tools, in theory, can give us a GDB-like experience in production. Cloud Debugger and other tools are paving the path to a better production debugging experience.
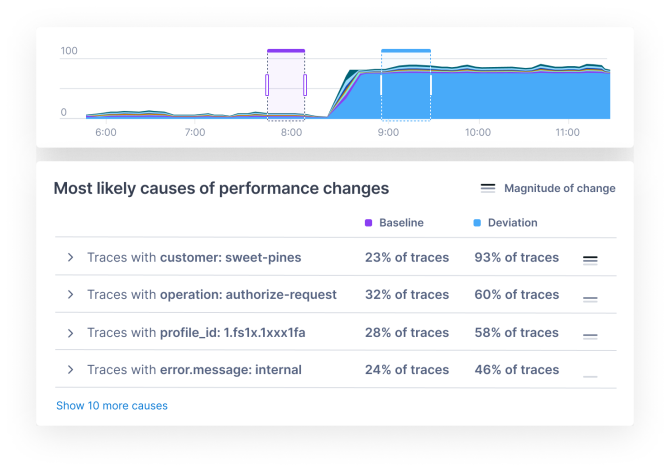
Automatic Analysis
Often, the issue with production logs and metrics is their sheer volume and the poor signal/noise ratio. Developers often have to manually create custom “triage” dashboards to help narrow down problems. This requires continuous manual work and upkeep, and developers might easily miss the right set of metrics to help resolve the next large outage.
To solve this, products like Lightstep surface correlations between metrics and traces to automatically narrow down regressions. For example, the tool can automatically find related traces when there's a regression on a latency or availability dashboard. Honeycomb provides “BubbleUps” to surface anomalous data in their heatmaps. Sentry provides Trends to catch recent performance regressions.
 a.image2.image-link.image2-471-670 {
padding-bottom: 70.29850746268657%;
padding-bottom: min(70.29850746268657%, 471px);
width: 100%;
height: 0;
}
a.image2.image-link.image2-471-670 img {
max-width: 670px;
max-height: 471px;
}
a.image2.image-link.image2-471-670 {
padding-bottom: 70.29850746268657%;
padding-bottom: min(70.29850746268657%, 471px);
width: 100%;
height: 0;
}
a.image2.image-link.image2-471-670 img {
max-width: 670px;
max-height: 471px;
}
Collaboration
As engineering teams get smaller, more efficient, and more generalized, sharing tribal knowledge seamlessly will be more crucial than before. Code review and pair programming are traditional methods for sharing knowledge in an engineering team, but there’s no generic collaborative process for debugging code that’s widely practiced and part of the standard development flow. Observability tools, however, can drive collaboration in the debugging workflow. Honeycomb lets you browse query histories of your coworkers so you might be able to find out what they looked at during a rollout or an outage. PixieLabs lets you develop and share scripts that interact with the platform, which creates an automatic knowledge base and community.
In general, each phase of the developer workflow is becoming more open. Google streams the result of developers’ every local build operation to a tool called Sponge so that coworkers could help out with tricky build failures by just reading a “Sponge” link, and startups like BuildBuddy have enabled a similar feature for its customers. GitHub Codespaces and Replit shift entire development environments to the cloud, which drives substantial benefits like snapshots, replays, and not having to deal with Git’s terrible UX. We can imagine that the entire sequence of build and debug operations done by engineers will be replayable and shareable within a team eventually.
Segmentation
As “Software Eats the World”, observability can get better as it targets niches’ specific pain points. Machine Learning based software companies need tools for better understandability that’s different from traditional SaaS applications, which creates a need for AI Observability tools. One example is that data quality needs to be monitored for cleanness and staleness for a production machine learning model to continue delivering results, which cannot easily be checked by an off-the-shelf observability tool. Companies concerned about data security and privacy might opt for observability of their data and APIs, and large enterprises that usually care more about vendor lock-in and extensibility can choose high-quality Open Source systems.
Overall, as software seeps into every company, it follows that software upkeep (via observability) will need to be extremely varied to keep up with customer needs.
Conclusion
The observability space is primed for growth. Standards like OpenTelemetry are stabilizing and reaching 1.0, which provides a stable target for software vendors to develop innovative products and reduce fear around vendor lock-in. New technology like eBPF will further make it safer and easier to observe more data from our systems. Finally, other software verticals like AI will need customized observability tools (and there will be startups to fulfill these). These will be contributing factors for observability systems growing from early adopters to the early majority in the growth curve. The open question for a particular company’s success is around discoverability, marketability, and how big of an improvement they drive - will companies be able to create a meaningful, industry-wide difference in developer workflows. GitHub pulled that off through a collaborative code review platform, and we’ll only know with time if other offerings will make a similar level of impact.
At a higher level, I’ve often mentioned that developers don’t particularly care about their systems' infrastructure and are just interested in delivering value to their customers as quickly as possible. With that perspective, any custom code for monitoring and debugging systems is not as valuable as code providing direct business value, and tools that help developers understand systems with less work will continue to grow in popularity.
This doesn’t include languages like Erlang which lets you hot-swap code


