TL;DR: In this tutorial, we'll learn how to build a metrics dashboard with Apache Superset, a modern and open-source data exploration and visualization platform. We'll also use Cube, an open-source metrics store, as the data source for Superset that will enable our dashboards to load in under a second — quite the opposite to what you'd usually expect from a BI tool, right?
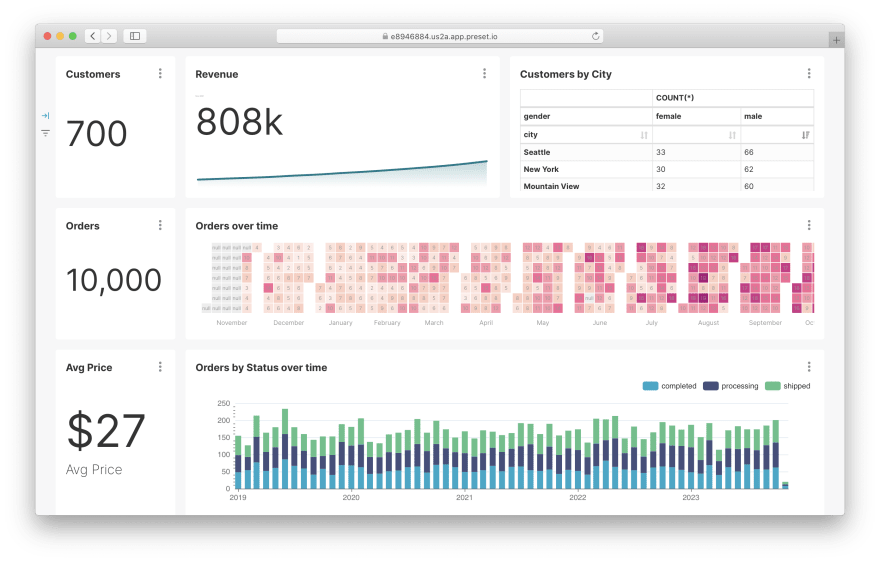
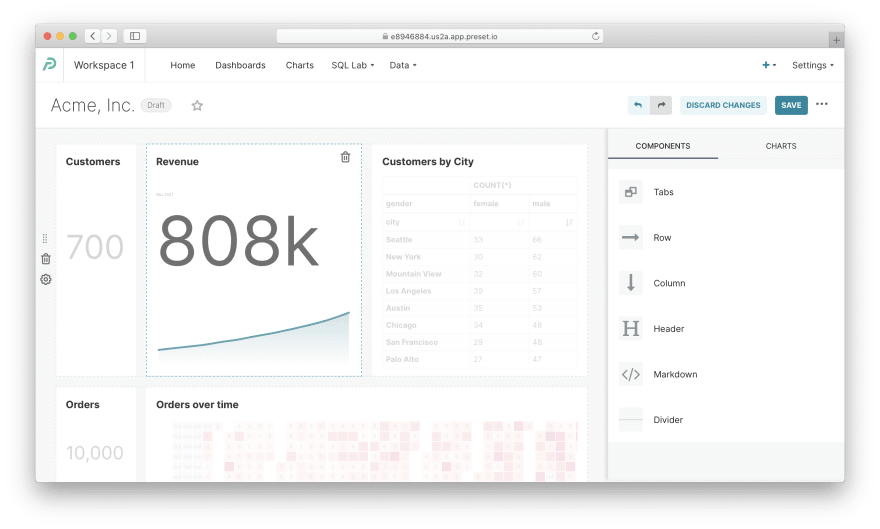
Here's how the end result will look like:
Now we're all set. Let's see what's on the shelves of this metrics store 🏪
What is Apache Superset?
Apache Superset is a data exploration and visualization platform or, in layman's terms, a tool that you can use to build dashboards with charts for internal users. Born at a hackathon at Airbnb back in 2015, with more than 41,000 stars on GitHub, now it's a leading open-source business intelligence tool.
Superset has connectors for numerous databases, from Amazon Athena to Databricks to Google BigQuery to Postgres. It provides a web-based SQL IDE and no-code tools for building charts and dashboards.
Running Superset. Now let's run Superset to explore these features. To keep things simple, we'll run a fully managed Superset in Preset Cloud, where you can use it forever for free on the Starter plan. (If you'd like to run Superset locally with Docker, please see these instructions.)
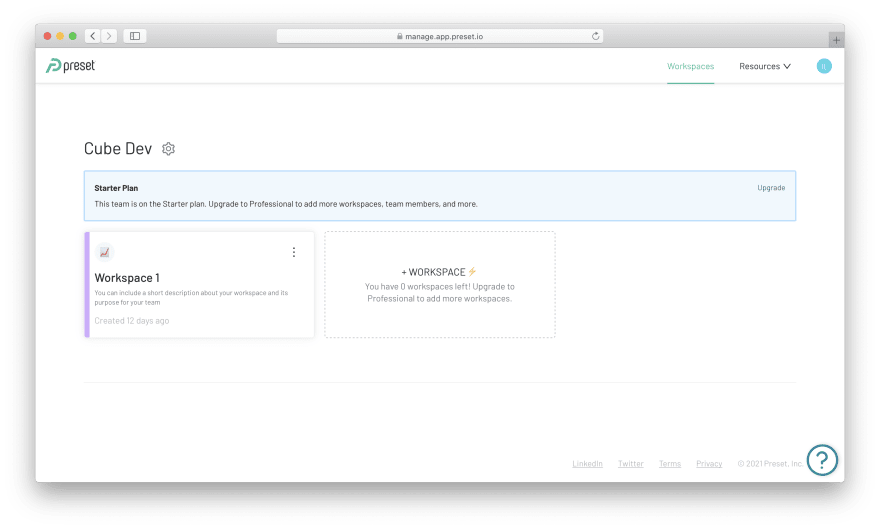
First, please proceed to the sign up page and fill in your details. Note that Preset Cloud supports signing up with your Google account. Within a few seconds you will be taken to your account with a readily available workspace:
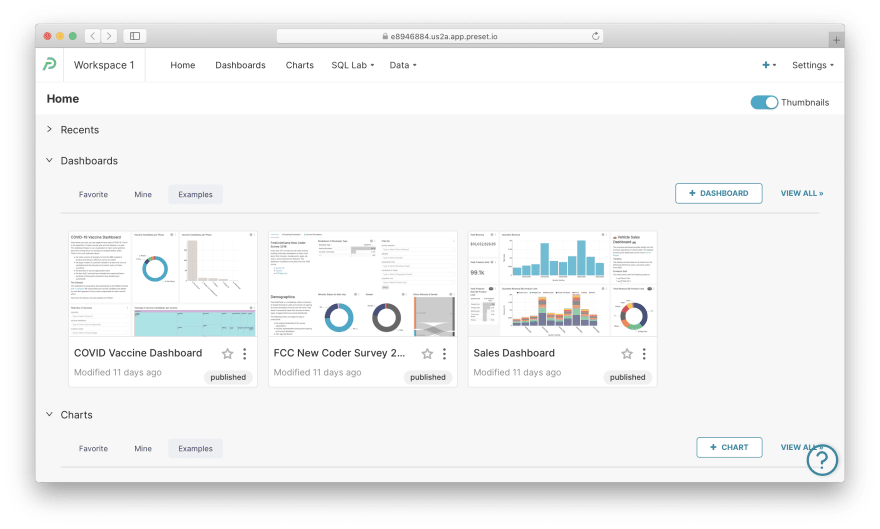
Switching to that workspace will reveal a few example dashboards that you can review later.
Now, let's navigate to Data / Databases via the top menu and... Oops! We need a metrics store to connect to. Let's see how Cube can help us build one.
What is Cube?
Cube is an open-source metrics store with nearly 12,000 stars on GitHub to date. It serves as a single source of truth for all metrics and provides APIs for powering BI tools and building data apps. You can configure Cube to connect to any database, define your metrics via a declarative data schema, and instantly get an API that you can use with Superset or many other BI tools.
Running Cube. Similarly to Superset, let's run a fully managed Cube in Cube Cloud that has a free plan as well. (If you'd like to run Cube locally with Docker, please see these instructions.)
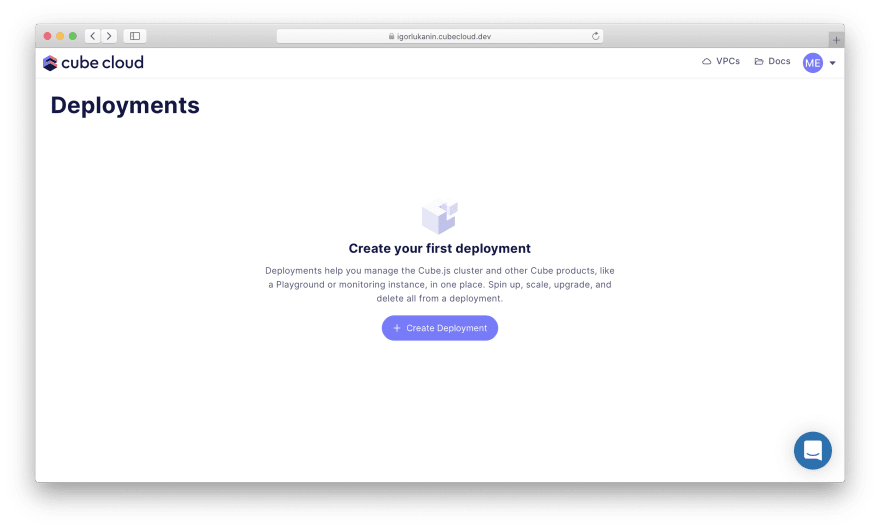
First, please proceed to the sign up page and fill in your details. Note that Cube Cloud supports signing up with your GitHub account. Within a few seconds you will be taken to your account where you can create your first Cube deployment:
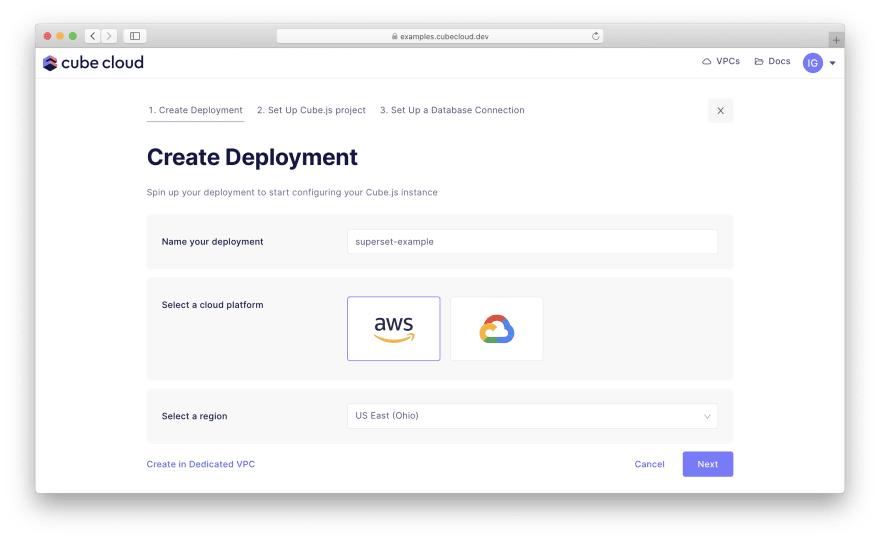
Proceed with providing a name for your deployment, selecting a cloud provider and a region:
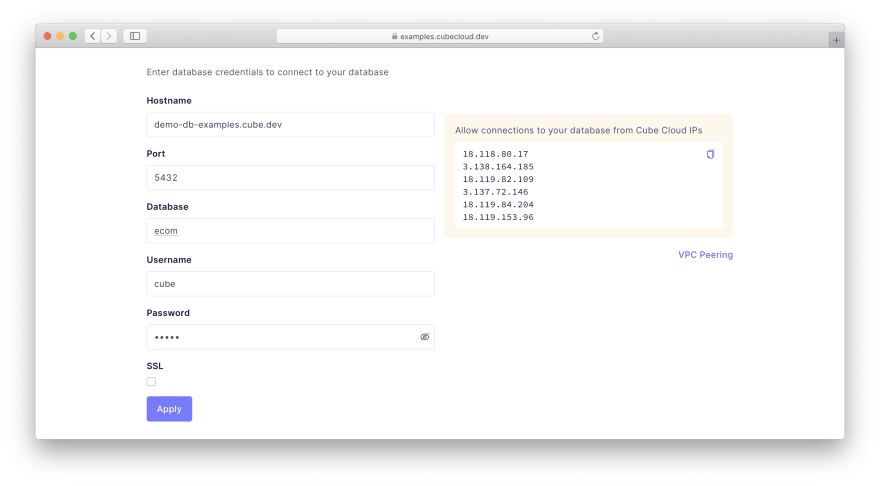
At the next step, choose Create to start a new Cube project from scratch. Then, pick Postgres to proceed to the screen where you can enter the following credentials:
Hostname:  demo-db-examples.cube.dev
Port:      5432
Database:  ecom
Username:  cube
Password:  12345
Cube will connect to a publicly available Postgres database that I've already set up.
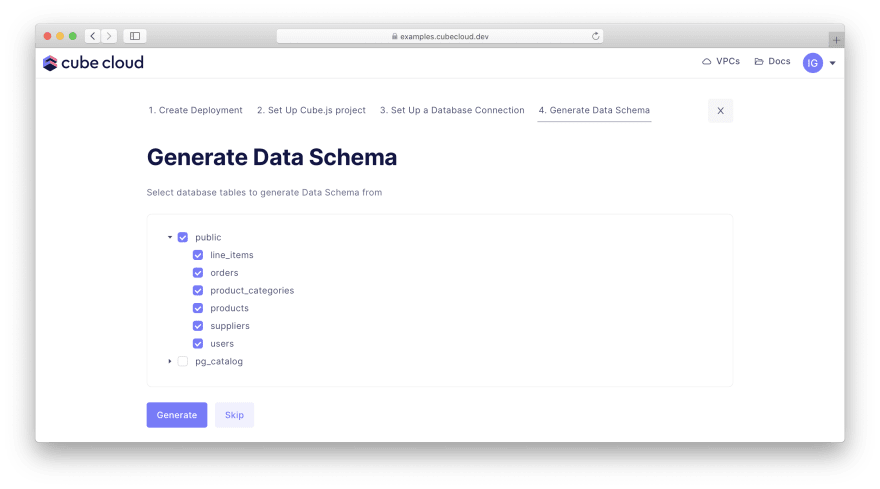
The last part of configuration is the data schema which declaratively describes the metrics we'll be putting on the dashboard. Actually, Cube can generate it for us! Pick the top-level public database from the list:
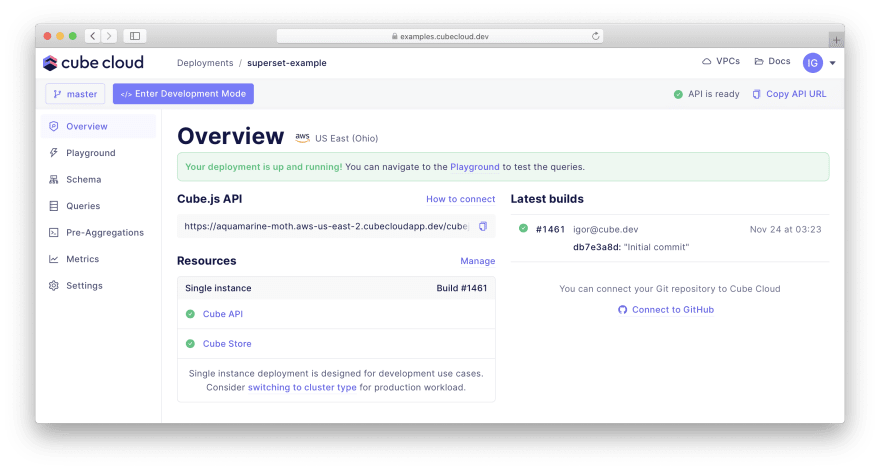
In a while, your Cube deployment will be up and running:
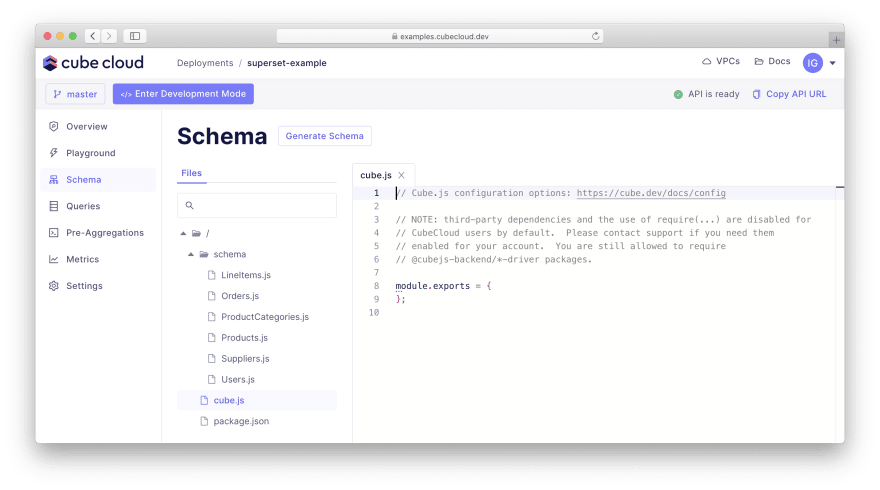
Defining metrics. Please navigate to the "Schema" tab. You will see files like LineItems.js, Orders.js, Users.js, etc. under the "schema" folder.
Let's review LineItems.js which defines the metrics within the "LineItems" cube. This file is different from the one in Cube Cloud, but we'll take care of that later.
cube(`LineItems`, {
  sql: `SELECT * FROM public.line_items`,

  measures: {
    count: {
      type: `count`
    },

    price: {
      sql: `price`,
      type: `sum`
    },

    quantity: {
      sql: `quantity`,
      type: `sum`
    },

    // A calculated measure that reference other measures.
    // See https://cube.dev/docs/schema/reference/measures#calculated-measures
    avgPrice: {
      sql: `${CUBE.price} / ${CUBE.quantity}`,
      type: `number`
    },

    // A rolling window measure.
    // See https://cube.dev/docs/schema/reference/measures#rolling-window
    revenue: {
      sql: `price`,
      type: `sum`,
      rollingWindow: {
        trailing: `unbounded`,
      },
    }
  },

  dimensions: {
    id: {
      sql: `id`,
      type: `number`,
      primaryKey: true
    },

    createdAt: {
      sql: `created_at`,
      type: `time`
    }
  },

  dataSource: `default`
});
Key learnings here:
- the cube is a logical entity that groups measures and dimensions together
- using the
sqlstatement, this cube is defined over the entirepublic.line_itemstable; actually, cube can be defined over an arbitrary SQL statement that selects data - measures (quantitative data) are defined as aggregations (e.g.,
count,sum, etc.) over columns in the dataset - dimensions (qualitative data) are defined over textual, numeric, or temporal columns in the dataset
- you can define complex measures and dimensions with custom
sqlstatements or references to other measures
Development mode. Now, let's update the schema file in Cube Cloud to match the contents above. First, click Enter Development Mode to unlock the schema files for editing. This essentially creates a "fork" of the Cube API that tracks your changes in the data schema.
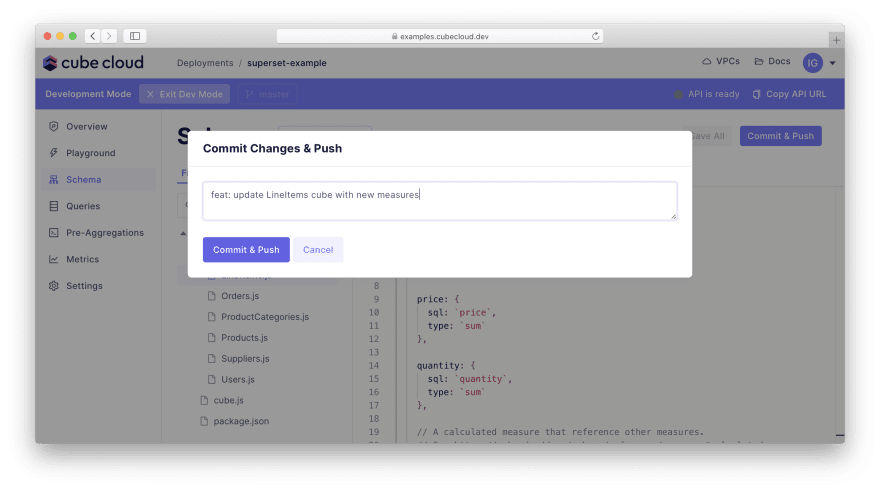
Navigate to LineItems.js and replace its contents with the code above. Then, save your changes by clicking Save All to apply the changes to the development version of your API. You can apply as many changes as you wish, but we're done for now. Click Commit & Push to merge your changes back to the main branch:
On the "Overview" tab you will see your changes deployed:
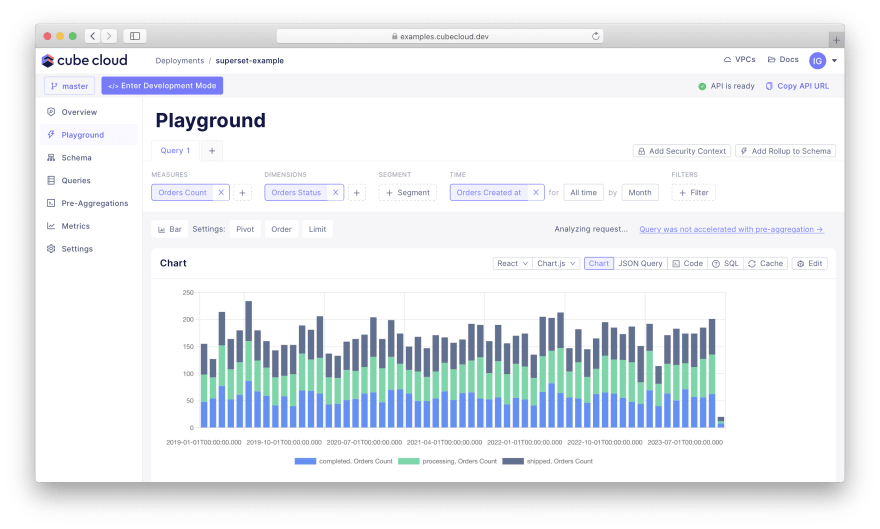
Now you can explore the metrics on the "Playground" tab:
Good! We've built a metrics store that we can connect to Superset. How?
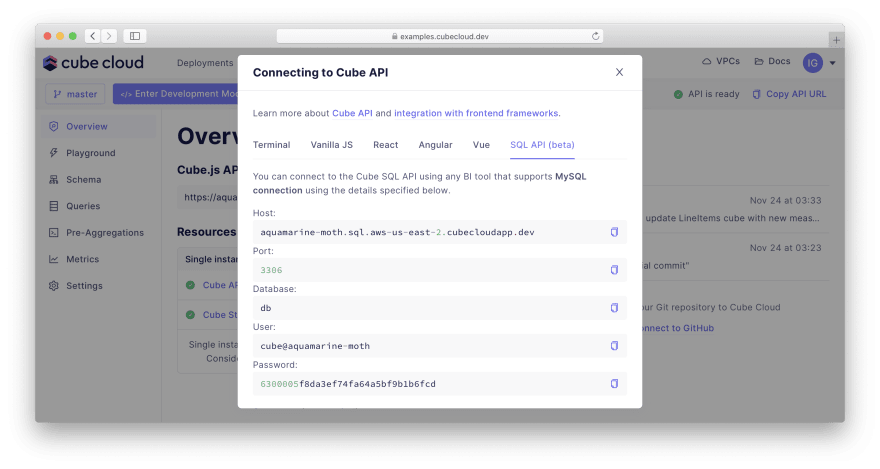
Please go back to the "Overview" tab and click How to connect. The "SQL API" tab will have a toggle that enables the API for Superset and other BI tools. Turning it on will provide you with all necessary credentials:
Now, let's build a dashboard!
Building a dashboard in Superset
We'll need to go through a few steps:
- connect Superset to Cube
- define the datasets
- create charts and add them to a dashboard
Let's go!
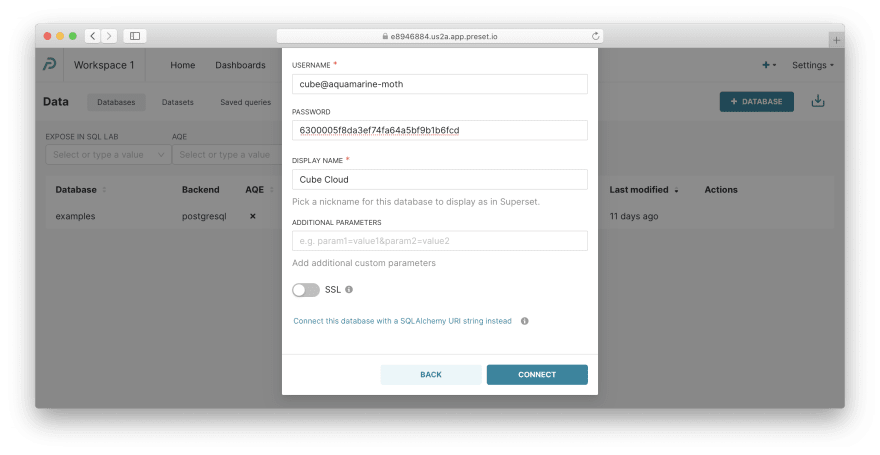
Connect Superset to Cube. Switch back to the workspace we've created earlier. Then, navigate to Data / Databases via the top menu, click + Database, select MySQL, and fill in the credentials from your Cube Cloud instance — or use the credentials below:
- Host:
aquamarine-moth.sql.aws-us-east-2.cubecloudapp.dev - Port:
3306 - Database name:
db - Username:
cube@aquamarine-moth - Password:
6300005f8da3ef74fa64a5bf9b1b6fcd - Display name:
Cube Cloud(it's important)
You can press Connect now.
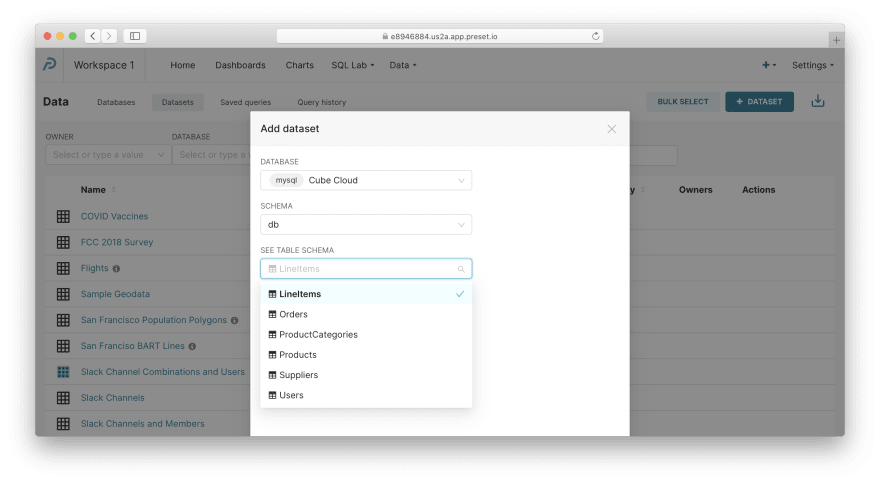
Define the datasets. Navigate to Data / Datasets via the top menu, click + Dataset, and fill in the following credentials:
- Database:
Cube Cloud(the one we've just created) - Schema:
db - See table schema:
LineItems
You can press Add now. Then, please repeat this for Users and Orders.
Create charts and a dashboard. We'll take a leap and create everything in a single step.
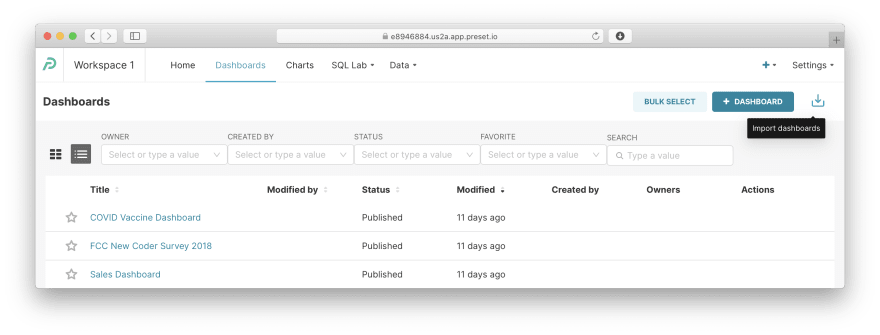
In Superset, you can export a dashboard with all charts as a JSON file and import it later. Navigate to Dashboards and click the link with an icon on the right:
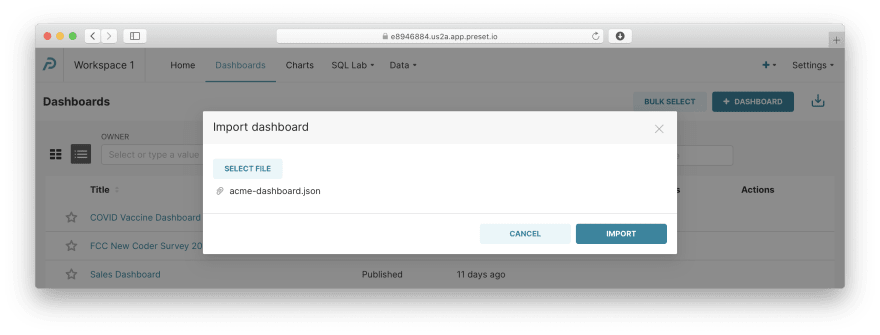
Download this file to your machine, select it, and click Import:
Whoa! Now we have a complete dashboard for Acme, Inc. Click on it to view:
Looks nice, doesn't it? Let's explore what's under the hood and how you can build it on your own.
Diving deep into Superset
Anatomy of a dashboard. You can see that charts on the dashboard are aligned by the grid. To rearrange them, click on the pencil icon in the top right corner. You can add tabs, headers, dividers, Markdown blocks, etc. Of course, you can also add charts.
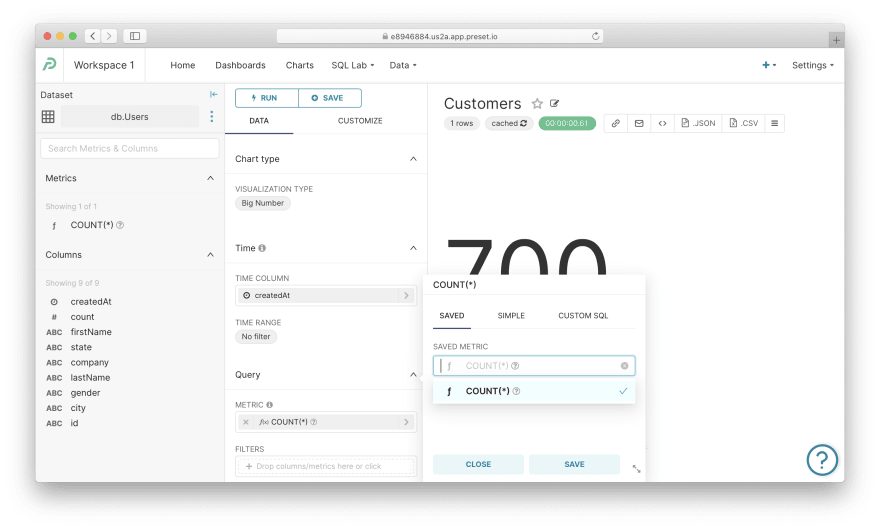
The simplest chart. Navigate to Charts via the top menu and click on any chart with the Big Number visualization type, e.g., Customers. In my opinion, that's the simplest chart you can create in Superset. It contains a single metric, and I doubt a chart can get simpler than that.
Let's dissect how a chart is defined:
- Visualization type:
Big Number— that's where you can select or change the chart type - Time column:
createdAt— interestingly enough, any chart should have this time column defined even if the displayed data has no temporal components - Metric:
COUNT(*)— that's the most important part of any chart configuration; upon clicking on this metric, you'll see that you can either select a saved definition, "simply" select a column and an aggregation, or write a "custom SQL" expression
When all config options are set, press Run to fetch the data, then Save to persist a chart or add it on a dashboard (no need to do it now, it's already added).
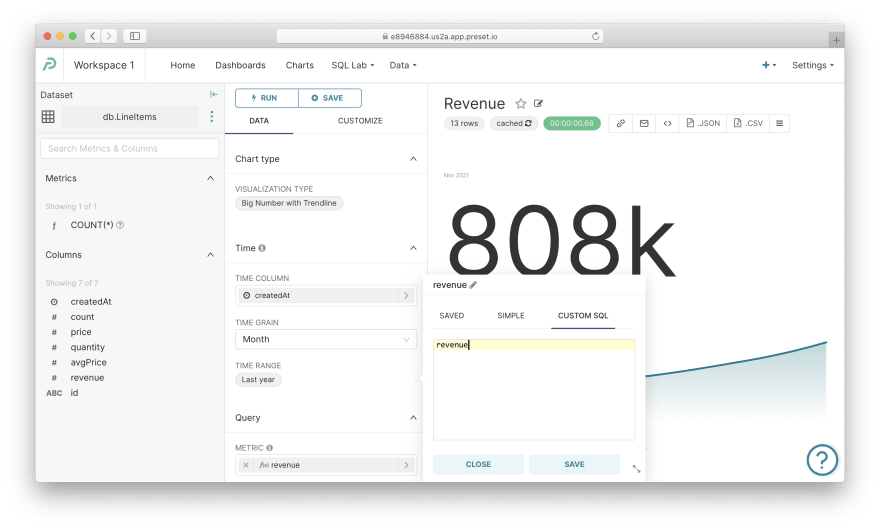
A less simple chart. Navigate to Charts via the top menu and click on any chart with the Big Number with Trendline visualization type, e.g., Revenue. Still, it contains a single metric as well as a sketchy chart in the bottom.
Let's dissect how this chart is defined (only new options):
- Time grain:
Month— defines the temporal granularity for metrics calculations - Time range:
Last year— specifies the date range for this chart - Metric:
revenue— it's interesting; click on this metric to learn that it's defined using "custom SQL"; that's because the aggregation has already been performed by Cube, no need to aggregate aggregated values, right?
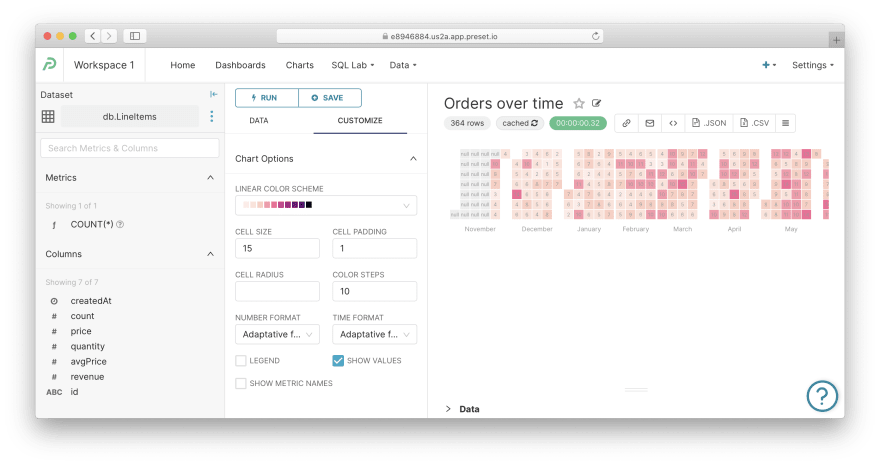
Other charts. Actually, now you know everything you need to explore and dissect other charts. Just keep in mind that Superset has plenty of customizations you can apply to charts — see the "Customize" tab for inspiration.
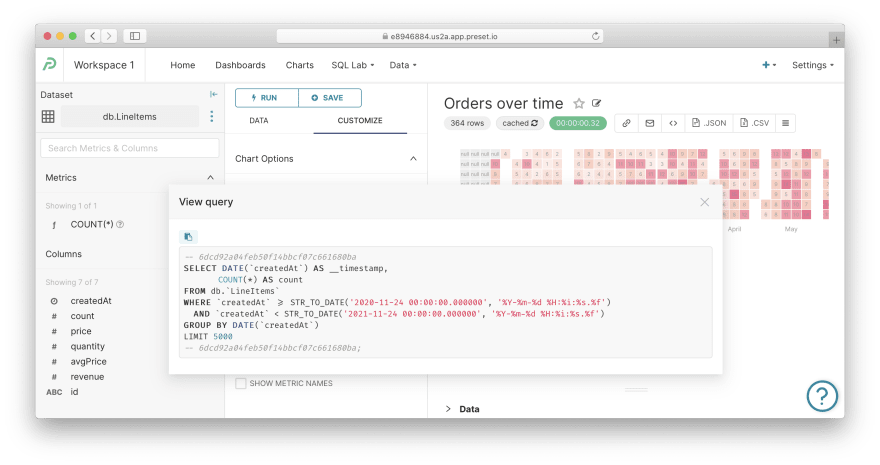
Viewing SQL. For any chart, you can reveal the SQL query to Cube which is generated by Superset to fetch the data. Press the burger button (with triple horizontal lines) in the top right corner, then View query. Good ol' SQL, nice:
Also, if you wanna use the aforementioned SQL IDE, navigate to SQL Lab / SQL Editor via the top menu.
Making business intelligence fast ⚡
There's only one thing left to explore, but it's a huge one.
Let's navigate back to the Acme, Inc. dashboard. It takes 2-3 seconds to load, and the infinity-shaped spinners are clearly visible. They are not annoying, but honestly — wouldn't you like this dashboard to load instantly? Yep, well under a second.
Cube provies an out-of-the-box caching layer that allows to pre-compute and materialize the data required to serve the queries. All you need to do is define which queries should be accelerated. It's done declaratively in the data schema files. (Please also note that Superset has its own lightweight caching layer that might be handy in cases when you need to push your Cube + Superset to the limit.)
Please go back to your Cube Cloud instance, enter the development mode, switch to the "Schema" tab, and update your data schema files with small snippets as follows.
First, LineItems.js should look like this:
cube(`LineItems`, {
  sql: `SELECT * FROM public.line_items`,

  // Copy me ↓
  preAggregations: {
    main: {
      measures: [ CUBE.count, CUBE.revenue, CUBE.price, CUBE.quantity ],
      timeDimension: CUBE.createdAt,
      granularity: 'day'
    }
  },
  // Copy me ↑

  measures: {
    count: {
      type: `count`
    },

  ...
Second, Orders.js should look like this:
cube(`Orders`, {
  sql: `SELECT * FROM public.orders`,

  // Copy me ↓
  preAggregations: {
    main: {
      measures: [ CUBE.count ],
      dimensions: [ CUBE.status ],
      timeDimension: CUBE.createdAt,
      granularity: 'day'
    }
  },
  // Copy me ↑

  measures: {
    count: {
      type: `count`
    },

  ...
Lastly, Users.js should look like this:
cube(`Users`, {
  sql: `SELECT * FROM public.users`,

  // Copy me ↓
  preAggregations: {
    main: {
      measures: [ CUBE.count ],
      dimensions: [ CUBE.city, CUBE.gender ]
    }
  },
  // Copy me ↑

  measures: {
    count: {
      type: `count`
    }

  ...
Don't forget to click Save All, then Commit & Push, and check that your changes were deployed at the "Overview" tab. In the background, Cube will build the necessary caches.
It's time to get back to your dashboard and refresh it. Now refresh it one more time. See? The dashboard loads in under a second. ⚡
Of course, you have plenty of options to fine-tune the caching behavior, e.g., specify the cache rebuilding schedule.
Wrapping up
Thanks for following this tutorial. I encourage you to spend some time in the docs and explore other features of Apache Superset. Also, please check out Preset docs that are packed with great content, e.g., on creating charts.
Also, thanks for learning more about building a metrics store with Cube. Indeed, it's a very convenient tool to serve as a single source of truth for all metrics.
Please don't hesitate to like and bookmark this post, write a comment, and give a star to Cube and Superset on GitHub. I hope these tools would be a part of your toolkit when you decide to build a metrics store and a business intelligence application on top of it.
Good luck and have fun!





Top comments (0)