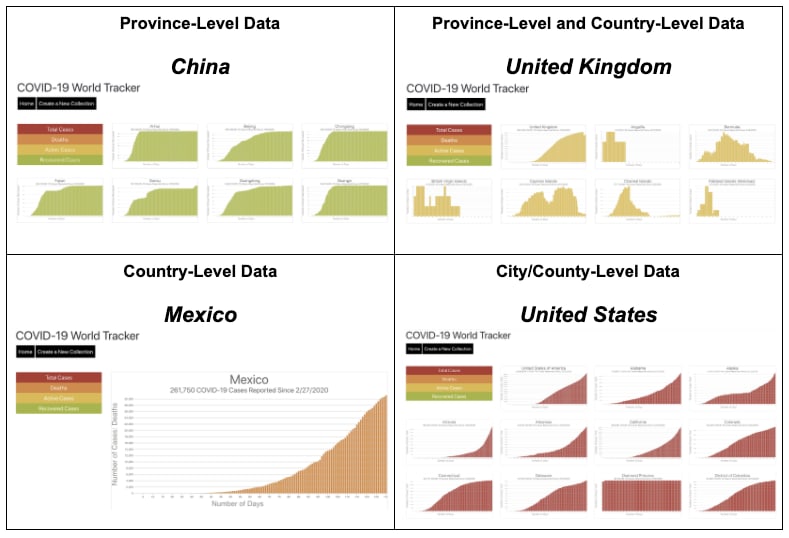
After taking a month off from working on my COVID-19 World Tracker application, a lot has changed in my country and our world. Originally, I had wanted my tracker to provide a map and dashboard to compare data with a global perspective, but after sharing my app and collecting feedback, it is clear that most people want and need to consider the global trends in comparison to what is happening locally in their own province or state. So this weekend I sat down and added a province/state dashboard for each country to provide that perspective.
Note: I have not merged these updates nor re-deployed the site yet, but if you would like to check it out, just visit the demo_7_06_updates branch from my github repository.
The Challenge: Country-Specific Data Reporting Structures
When I used the Novel COVID API to render current data on the map, the data for all countries was reported consistently.
When I used the Coronavirus COVID19 API Day One data, most countries were reporting data in a similar fashion, but I needed to troubleshoot China and Australia, which were only reporting data on a provincial level with the original API endpoint that I was using. After exploring more endpoint options and filtering the data, I was able to overcome that inconsistency fairly quickly.
However, when I started using the Coronavirus COVID19 API "Day One All Status" endpoint, I was presented with much more inconsistency in how data was reported and structured in the API fetch results:
Province-Level Data (China and Australia)
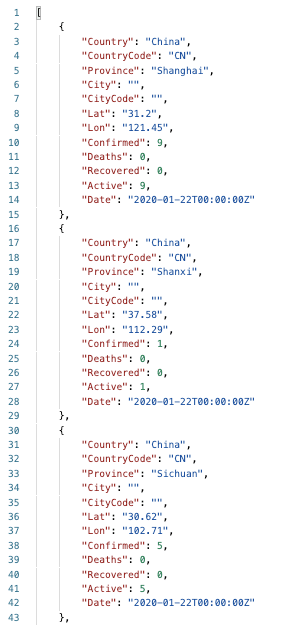
Some countries broke down their data by province, without providing a country-level total. Note that the three entries represent the same date, but each represents a different province in China.

Province-Level and Country-Level Data (United Kingdom and its territories)
Other countries broke down their data by province, but also included country-level totals. Note that the three entries represent the same date, but the first entry has no province (representing the UK as a whole), while the next two entries represent different territories of the UK (Channel Islands and Gibraltar).

Country-Level Data (Mexico)
Many countries reported only country-level data, without breaking it down by province. In this example, you can see that each entry represents country-wide totals for a single date.

City/County-Level Data (United States)
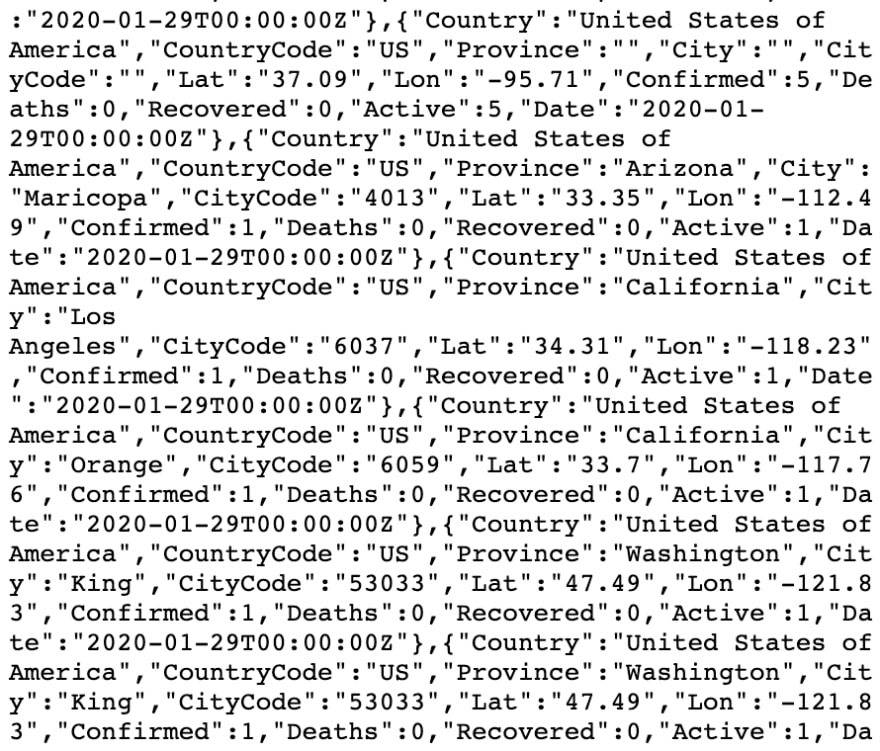
Only one country broke down data by state as well as city/county, without providing a total for individual states. However, it did provide a total for the entire country. The fetch for US data returned an array of around 270,000 data objects, which was too many for Postman or Chrome to make pretty, so here is a screenshot of the raw results. Note that on January 29th, we can see data for the US as a whole (5 confirmed cases), Arizona (Maricopa County - 1 case), California (city of Los Angeles - 1 case, and Orange County - 1 case), and Washington State (King County - 2 cases, but reported in separate data entries).

Solutions, by Category
With this much variation in the data, I needed to build an array of provinces for each country, and then use conditional logic to first analyze the type of data that was in the provinces array, and then use different strategies to parse and visualize the data. (Note: some code that is not relevant to the discussion is removed)
Show.js
const Show = (props) => {
    const provincesData = useSelector(state => state.provincesData)
    const [provinces, setProvinces] = useState([])
    const [isLoading, setIsLoading] = useState(false);
    const dispatch = useDispatch()

    useEffect( () => {
        async function fetchData() {
            setIsLoading(true);

            var requestOptions = {
                method: 'GET',
                redirect: 'follow'
              };

            const response = await fetch("https://api.covid19api.com/dayone/country/" + props.location.slug, requestOptions)
            const data = await response.json()
            dispatch({ type: 'addProvincesData', payload: data})

            const provinceArray = []
            data.forEach(d => {
                if (!provinceArray.includes(d.Province) && d.Province !== "") {
                    provinceArray.push(d.Province)
                } else if (!provinceArray.includes("") && d.Province === "")
                    provinceArray.push("")
            })

            setProvinces(provinceArray.sort((a,b) => a > b ? 1 : -1))
            setIsLoading(false);
        }
        fetchData();
    }, []);
This code snippet illustrates how I fetched country data, and then iterated through the fetched data and created an array of all of the unique provinces within the fetched results (including the empty value), and then sorted them alphabetically. If a country included entries for the country as a whole (represented in the data as Province: ""), then that would precede all of the other provinces.
I then tackled one data category at a time by adding conditional logic into my Show component, which is the component responsible for fetching the country's data, breaking it out by province, and then passing down the provincial data down to a Province or State component. This is represented in pseudo-code below, and illustrated in more detail in the next sections.
Show.js
// Logic if country is United States (because state data is broken down into cities)
if (provinces.includes("Alabama")) {
  return (
        // Use map to iterate through the provinces array
        // Use each state name to filter the country's fetched results
        // Pass an array of data for each state to the State component
  )

// Logic for countries that are not broken down into provinces (such as Mexico)
} else if (provinces.length === 1) {
  return (
        // Pass the entire provincesData array to the Province component
  )

// Logic for all countries that have data broken down by province (such as China, or United Kingdom)
} else {
  return (
        // Use map to iterate through the provinces array
        // Use each province name to filter the country's fetched results
        // Pass an array of data for each province to the Province component
  )
}
Province-Level and Country-Level Data (China and Australia) AND Province-Level and Country-Level Data (United Kingdom and its territories)
In order to address these cases, I mapped through the provinces array, filtered the data by province name, and passed each province's data down to a child Province component. This logic was run if the provinces array length was greater than 1.
Show.js
{provinces.map((province, index) => {
  return (
    <Province
      caseType={caseType}
      province={province}
      provinceData={provincesData.filter(day => day.Province === province)}/>
  )
})}
The province component then defined a number of constants and parsed the data that would be needed to generate the bar charts, and rendered the Viz component, which was ultimately responsible for integrating with D3 and calling the D3 function to draw the bar chart for each province. The Province component can be viewed here.
Country-Level Data (Mexico)
In order to address these cases, no filtering was necessary, so I passed all of the data down to the child Province component. This logic was run if the provinces array length was equal to 1.
Show.js
return (
  <Province
    caseType={caseType}
    province={provincesData[0].Country}
    provinceData={provincesData}/>
  )
The only other difference was that the column widths were changed so that the chart appeared full-screen.
City/County-Level Data (United States)
First, I needed to identify a condition to test whether the logic should be run for this data category, so I checked whether a US state name was included in the provinces array. I then used similar logic as I used in the first examples (for countries such as China and United Kingdom, but passed the data down to a different child component, named State, which would be able to parse the data one level further.
Show.js
if (provinces.includes("Alabama")) {
  {provinces.map((state, index) => {
    return (
      <State
      caseType={caseType}
      state={state}
      stateData={provincesData.filter(day => day.Province === state)}
      countryName={provincesData[0].Country}/>
    )
  })}
}
In this case, the data for each state was passed to a new State component because there was an additional level of parsing that needed to be completed before rendering a state-level chart. The data coming into the State component included a separate entry on each date for each county (and some cities). Therefore, I needed to transform the data to include one entry per date, which accumulated the data across all counties and cities for that date. I did this using for loops to accumulate the data for each caseType.
State.js
const State = ({caseType, state, stateData, countryName}) => {
  state ? state = state : state = countryName
  const slug = (state) => { //logic to slugify the name}

  const array = []
  const parseData = (stateData, array) => {
    stateData.forEach( day => {
      const date = day.Date.substring(0, 10)
      if (!array.includes(date)) {
         array.push(date)
       }
     })

     const dateArray = array.map(date => stateData
       .filter(day =>  day.Date
       .substring(0,10) === date))

     const parsedData = dateArray.map( (d, index) => {
       const dayCount = index + 1
       const date = new Date(d[0].Date)

       const total = () => {
         let sum = 0
         for (let element of d) {
         sum += element.Confirmed
         }
         return sum
       }

       // similar function used to generate cumulative result for active, recovered, and deaths

       return {
         dayCount,
         date,
         total: total(),
         active: active(),
         recovered: recovered(),
         deaths: deaths()}
            })
     return parsedData
  }

  const dailyData = parseData(stateData, array)
  const totalCases = dailyData[dailyData.length - 1].total

  return (
    <Viz
      countryName={state}
      totalCases={totalCases}
      dailyData={dailyData}
      caseType={caseType}
      slug={slug(state)}/>
  )
}
Final Steps
After parsing the province-level and state-level data in the Province or State component, the Viz component is called. At this point, regardless of the original fetched data structure, the data for all provinces/states has been parsed into a uniform format that can be passed into the Viz component.
Viz.js
const Viz = ( {caseType, countryName, totalCases, dailyData, slug}) => {

    useEffect( () => {

        DrawBar(countryName, totalCases, dailyData, slug, caseType)
    }, [caseType])

    return (
        <div className={"viz" + slug} ></div>
    )
}
As a result, each country's show page will render correctly based on whether Province/State-level is available, and all charts can be interacted with by using the caseType buttons on the left sidebar to show total cases, active cases, deaths, and recovered cases (although recovery data is generally not available at the province/state level).
Next Steps
Before deploying this updated version of the site, I have a number of details to tackle:
- Continue implementing redux hooks to better manage state across the application
- Fetch United States state data earlier (since the lag time is currently about 15 seconds to fetch such a large object)
- Implement caching of data since the API seems to be becoming less reliable
- Add loading indicators across all views
- Add automatic redirects to home for pages that do not have country data
- Refactor, refactor, refactor - by splitting larger components into multiple smaller components and cleaning up some functions


Top comments (0)